If
you haven't already done so, please read the MRCA
section on the Camera Towns page
MRCA
Documents & Info
Yes, this is the webpage with a LOT of
info about the tickets from the stop sign cameras found
in the hills around LA.
But first, this important political announcement
...
In 2018, Vote No on Sheila Kuehl
Was Zev Yaroslavsky your County
Supervisor? (Until late 2014 he represented the
Third District, which includes the central and western
San Fernando Valley, Malibu, Santa Monica, Venice,
Beverly Hills, the City of West Hollywood, and part of
Hollywood.)

Sheila "Kuehl Cams" Kuehl, in 2007
During her career in the California
Legislature, Kuehl made three attempts to pass bills to allow
the use of automated speed enforcement (photo radar) in
California.
She also voted to put an additional LA County-wide sales tax, to go to Metro, on the Nov. 2016 ballot. (See Measure M on the Action/Legis page, for more about that tax.)
Kuehl will be up for re-election in Nov. 2018 and Nov. 2022.
March 2015: A bill prohibiting stop sign cameras
was introduced in the California legislature, but didn't
pass. Read about SB 218 on the Action/Legis page.
MRCA
Docs Set # 1
Ticket
Counts - Stop Signs!
The fine was $100 in 2007. By
early 2011 it had risen to $175, but in early 2012 it
was reduced to $100. The lower fine will not be
applied, retroactively, to pre-reduction tickets.
The photo enforcement at stop signs is by "fixed"
(permanently installed) cameras; the initial contract
with RedFlex also called for speed enforcement (photo
radar), but that was canceled before it started.
The speed enforcement was to be done by mobile units -
maybe some recycled from the City of San Jose, which in
2007 was forced to discontinue its RedFlex photo radar
program, the only one in the State at that time.
(For more info about San Jose, see their page,
elsewhere on this site.)
Total
Violations, Notices Printed [4]
| Cam # |
FRDST 01 |
FRTHD 01 |
FRUST 01 |
REUST 01 |
STST 01 |
TECA 01 |
TOST 01 |
|
|
|
||||
| MRCA RedFlex Cameras |
Franklin Park Nbd [6] |
Franklin Park Trailhead Nbd [6] |
Franklin Park Sbd [6] |
Reseda Nbd [6] |
Hollywood Bowl Outlook/ Temescal Ebd [6] |
Temescal Nbd [6] |
Topanga Wbd [6] |
[3] |
Total Tickets Issued as % of Events Re- corded |
Total Violations Recorded/ Notices Printed [1] [4] |
||||
| 12 days Jul07 [10] |
195 190 |
0 0 |
452 179 |
0 0 |
553 236 |
0 0 |
214 80 |
1414 585 |
||||||
| Aug07 [10] |
655 199 |
0 0 |
1076 422 |
0 0 |
1177 579 |
0 0 |
788 424 |
3696 1624 |
||||||
| Sep07 [10] |
542 169 |
0 0 |
500 256 |
922 232 |
773 436 |
52 0 |
567 334 |
3356 1427 |
||||||
| Oct07 [10] |
442 171 |
0 0 |
461 199 |
0 0 |
779 434 |
989 215 |
475 269 |
3146 1288 |
||||||
| Nov07 |
||||||||||||||
| 4th Qtr 2007 |
9134 3596 |
|||||||||||||
| 2007 |
||||||||||||||
| 1st Qtr 2008 |
8752 2815 |
|||||||||||||
| 2nd Qtr 2008 |
1516 404 |
0 0 |
1605 544 |
0 0 |
2801 866 |
1418 531 |
1122 531 |
8462 2876 |
||||||
| 3rd Qtr 2008 |
8094 3238 |
|||||||||||||
| 4th Qtr 2008 |
6769 4186 |
|||||||||||||
| 2008 [2] |
13115 |
|||||||||||||
| 1st Qtr 2009 |
10331 6098 |
|||||||||||||
| 2nd Qtr 2009 |
995 525 |
1101 558 |
1430 690 |
3381 1331 |
2644 1534 |
922 633 |
1502 815 |
11975 6086 |
||||||
| 3rd Qtr 2009 |
11973 6007 |
|||||||||||||
| 4th Qtr 2009 |
11015 6477 |
|||||||||||||
| 2009 [2] |
24668 |
|||||||||||||
| 1st Qtr 2010 |
11583 6070 |
|||||||||||||
| 2nd Qtr 2010 |
1070 471 |
1161 526 |
1561 572 |
3941 1725 |
3380 1655 |
720 399 |
1845 840 |
13678 6188 |
||||||
| 3rd Qtr 2010 |
12636 5161 |
|||||||||||||
| 4th Qtr 2010 [11] |
0 0 |
6884 2892 |
||||||||||||
| 2010 [2] |
20311 |
|||||||||||||
| 1st Qtr 2011 [11] |
0 0 |
8117 4200 |
||||||||||||
| 2nd Qtr 2011 [11] |
871 332 |
1144 549 |
1452 607 |
0 0 |
3652 1472 |
591 313 |
1646 643 |
9356 3916 |
||||||
| 3rd Qtr 2011 [11] |
0 0 |
9938 3684 |
||||||||||||
| 4th Qtr 2011 [11] |
607 262 |
7826 2832 |
||||||||||||
| 2011 [2] |
14632 |
|||||||||||||
| 1st Qtr 2012 [11] |
1469 575 |
8691 3831 |
||||||||||||
| 2nd Qtr 2012 [11] |
994 515 |
1277 734 |
1345 711 |
1635 767 |
3201 1886 |
548 392 |
1624 938 |
10574 5943 |
||||||
| 3rd Qtr 2012 [11] |
10296 5679 |
|||||||||||||
| 4th Qtr 2012 [11] |
7463 4461 |
|||||||||||||
| 2012 [2] |
19914 |
|||||||||||||
| 1st Qtr 2013 [12] |
8516 5206 |
|||||||||||||
| 2nd Qtr 2013 [13] |
819 496 |
1106 722 |
1253 746 |
1157 877 |
2987 1973 |
620 452 |
2087 1286 |
10029 6552 |
||||||
| 3rd Qtr 2013 [13] |
10725 6834 |
|||||||||||||
| 4th Qtr 2013 [13] |
9421 5764 |
|||||||||||||
| 2013 [2] |
24356 |
|||||||||||||
| 1st Qtr 2014 [13] |
841 436 |
1056 619 |
1458 757 |
1470 1055 |
3279 2187 |
416 286 |
1746 1010 |
10266 6350 |
||||||
| 2nd Qtr 2014 [14] |
1004 537 |
1362 846 |
1305 783 |
1288 903 |
2877 1807 |
427 303 |
1705 1018 |
9968 6197 |
||||||
| 3rd Qtr 2014 [15] |
1195 643 |
1737 885 |
1178 664 |
1265 886 |
2788 1654 |
537 354 |
1855 1086 |
10555 6172 |
||||||
| 4th Qtr 2014 [15] |
911 515 |
1298 753 |
952 495 |
1189 818 |
2791 1652 |
352 211 |
1974 917 |
9467 5361 |
||||||
| 2014 [16] |
40283 24080 |
|||||||||||||
| 1st Qtr 2015 [15] |
1391 803 |
1831 1062 |
2121 1024 |
1400 876 |
3166 1991 |
524 339 |
2213 1233 |
12646 7328 |
||||||
| 2nd Qtr 2015 [16] |
12223 6902 |
|||||||||||||
| 3rd Qtr 2015 [16] |
11563 6339 |
|||||||||||||
| 4th Qtr 2015 [16] |
10538 6374 |
|||||||||||||
| 2015 [2] |
46977 26943 |
|||||||||||||
| 1st Qtr 2016 [16] |
5892 1983 |
|||||||||||||
| 2nd Qtr 2016 [16] |
1993 291 |
2945 191 |
1824 234 |
1002 416 |
413 242 |
677 106 |
1346 177 |
10200 1657 |
||||||
| 3rd Qtr 2016 [17] |
10022 4663 |
|||||||||||||
| 4th Qtr 2016 [17] |
895 403 |
1170 320 |
1268 764 |
734 531 |
210 168 |
556 377 |
981 492 |
5814 3055 |
||||||
| 2016 [1] |
6043 1915 |
7827 1227 |
6285 2494 |
4234 2536 |
1061 740 |
2245 1023 |
4233 1423 |
31928 11358 |
||||||
| 1st Qtr 2017 [18] |
838 496 |
1422 575 |
1251 876 |
777 547 |
153 123 |
536 381 |
879 470 |
5856 3468 |
||||||
| 2nd Qtr 2017 [19] |
1187 753 |
3015 660 |
1875 1267 |
1110 866 |
241 195 |
920 690 |
1137 692 |
9485 5123 |
||||||
| July
2017 [19] [20] |
230 183 |
551 284 |
571 453 |
414 351 |
80 68 |
336 277 |
351 233 |
2533 1849 |
||||||
| Aug.
2017 [20] |
383 281 |
487 182 |
517 344 |
347 261 |
76 65 |
353 285 |
270 175 |
2433 1593 |
||||||
| Sep.
2017 [20] |
312 164 |
181 79 |
618 251 |
244 168 |
60 45 |
260 177 |
207 67 |
1882 951 |
||||||
| 3rd Qtr 2017 [2] |
925 628 |
1219 545 |
1706 1048 |
1005 780 |
216 178 |
949 739 |
828 475 |
6848 4393 |
||||||
| Oct.
2017 [20] |
252 120 |
235 86 |
594 186 |
236 134 |
68 56 |
239 167 |
272 35 |
1896 784 |
||||||
| Nov.
2017 [20] |
128 74 |
87 45 |
442 224 |
153 111 |
66 55 |
154 124 |
225 98 |
1255 731 |
||||||
| Dec.2017 [20] |
179 81 |
88 36 |
547 206 |
186 103 |
53 41 |
222 142 |
467 131 |
1742 740 |
||||||
| 4th Qtr 2017 [2] |
559 275 |
410 167 |
1583 616 |
575 348 |
187 152 |
615 433 |
964 264 |
4893 2255 |
||||||
| 2017 [2] |
3509 2152 |
6066 1947 |
6415 3807 |
3467 2541 |
797 648 |
3020 2243 |
3808 1901 |
27082 15239 |
||||||
| Jan.2018 [21] |
194 96 |
46 17 |
757 492 |
207 154 |
63 50 |
271 168 |
396 220 |
1934 1197 |
||||||
| Feb.2018 [21] |
583 333 |
121 62 |
710 446 |
249 185 |
63 50 |
274 205 |
315 196 |
2315 1477 |
||||||
| Mar.2018 [21] |
646 318 |
134 77 |
669 396 |
246 184 |
59 47 |
269 204 |
390 240 |
2413 1466 |
||||||
| 1st Qtr 2018 [2] |
1423 747 |
301 156 |
2136 1334 |
702 523 |
185 147 |
814 577 |
1101 656 |
6662 4140 |
||||||
| Apr. 2018 [21] |
888 390 |
205 105 |
946 567 |
422 311 |
73 64 |
394 302 |
479 191 |
3407 1930 |
||||||
| May 2018 [21] |
897 535 |
204 114 |
870 587 |
319 249 |
86 74 |
336 256 |
419 262 |
3131 2077 |
||||||
| Jun. 2018 [21] |
798 442 |
192 100 |
707 496 |
414 302 |
72 59 |
454 329 |
432 285 |
3069 2013 |
||||||
| 2nd Qtr 2018 [2] |
2583 1367 |
601 319 |
2523 1650 |
1155 862 |
231 197 |
1154 887 |
1330 738 |
9607 6020 |
||||||
| 3rd Qtr 2018 |
||||||||||||||
| 4th Qtr 2018 |
||||||||||||||
| 2018 [2] (proj.) |
8012 4228 |
1804 950 |
9318 5968 |
3714 2770 |
832 688 |
3996 2928 |
4862 2788 |
32538 20320 |
||||||
| Cam # |
FRDST 01 |
FRTHD 01 |
FRUST 01 |
REUST 01 |
STST 01 |
TECA 01 |
TOST 01 |
|
Total Tickets Issued as % of Events Re- corded |
|
This table made by highwayrobbery.net, using official reports provided by the MRCA under the California Public Records Act.
[ ] indicates a footnote.
[1] Totals are as provided by the MRCA.
[2] These annual totals, annual projections, or quarterly totals, are by highwayrobbery.net.
[3] Un-used columns are to allow for later expansion of MRCA's system.
[4] The figures in red type (or, if you are looking at this table in black and white, the upper figure when there are two or more figures in a cell) are what RedFlex calls Total Violations (later: Total Processed Incidents), or all incidents recorded by the cameras. The figures in black type are citations issued, what RedFlex calls Notices Printed.
Due to time limitations, location-by-location figures have been posted only for selected calendar quarters. Full quarterly data, and data for some calendar months, are available at the links below.
[5] Reports include some individual months.
[6] Per invoices from RedFlex to the MRCA, the camera enforcement is in the compass directions noted. See Set # 2, below, for a location map.
[7] Source data: 12+ months Jul07 - Jul08
[8] Source data: 12 months Aug08 - Jul09
[9] Source data: 1 - 3 month periods, 2008 - 2009
[10] Source data received Jan. 2011
[11] Source data received Jan. 2013
[12] Source data received June 2013
[13] Source data received July 2014
[14] Source data received Aug. 2014
[15] Source data received May 2015
[16] Source data received Oct. 2016 [5]
[17] Source data received Jan. 2017 [5]
[18] Source data received May 2017 [5]
[19] Source data received Oct. 2017 [5]
[20] Source data received July 2018
[21] Source data received Aug. 2018
MRCA Docs Set # 2
MRCA
Website,
Articles (Do You Have to Pay?)
The MRCA's
Ticket Website
MRCA's
Main Website
Website About
the MRCA's Director Archived Copy
If you have a ticket and want to contact the MRCA photo
stopsign program, their number is (310) 858-0117.
The direct number to the administration
at the MRCA is (310) 589-3230 ext. 112 or 118.
July
2007 Post Article
July
2007
Local Blog Article
July
2007 National Blog Article
Jan. 2008
Post
Article
Apr. 2008
Post Article
Dec. 22, 2009 Post Article About a
Defendant's Victory
In May 2010 freedomminute.com blogged about whether it is
necessary to pay MRCA tickets, and that article
started a string of comments that has continued into
2014. Also, there is a FAQ.
Jul.
2011
CBS-2 Report
Aug.
21,
2011 LA Times Article
Aug.
24,
2011 StreetsBlog Article (statement by MRCA Director)
Sept.
1,
2011 Post Article
Mar.
15,
2012
LA
Weekly
Article included this map of camera locations:
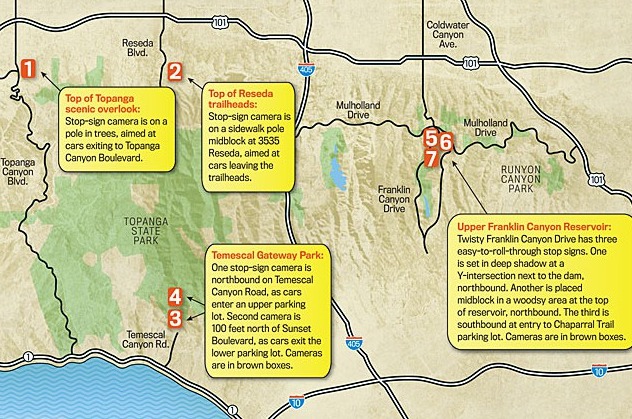
Map by Peter Hoey
An Aug.
9,
2012 LAWeekly Article revealed that in early 2012
the fine was reduced to $100. I inquired with MRCA
staff to find out if the lower fine will be applied,
retroactively, to tickets issued prior to the reduction.
It will not.
On Aug.
10,
2012 SaferStreetsLA blogged about the MRCA.
In July 2015 there was an appellate court decision
supporting the MRCA.
MRCA Docs Set # 3
The
Contract
In 2007 - evidently tired of toiling in obscurity - the
MRCA contracted with RedFlex for the installation of two
kinds of automated enforcement not permitted by
California law (and found nowhere else in California):
(1) Photo enforcement at stop signs (illegal
because CVC
22450, the usual Code section for a stop sign
violation, is not included in
CVC 40518, the Code section authorizing the use
of a mailed Notice to Appear), and (2) photo
enforcement of speed* (illegal because CVC
21455.6 says: "The authorization in Section
21455.5 to use automated enforcement systems does not
authorize the use of photo radar for speed enforcement
purposes by any jurisdiction").
2006
Staff
Report Recommending Signing of Contract - see item
V(b) in the report
The MRCA claims that their program is legal:
Feb. 2008 Memo
by MRCA's Attorney
Apr. 2008
Informal Opinion by AG
In 2010 two class action suits were filed against the
MRCA, and in 2011 and July 2015 there were decisions by
the appellate courts (See the Class Actions
page.)
A further illegal provision was found in the contract.
The contract's Exhibit D specified* that MRCA
would pay RedFlex $20 (fixed cam) or $40 (mobile cam)
for each image processed, a blatant violation of the CVC
21455.5(g) (as of 2013, CVC 21455.5(h)) prohibition of
such "pay-per-ticket" schemes. See Subsection B of
Defect # 10.
*In May 2008 the contract was amended
to remove the provision for speed
enforcement and to set compensation to RedFlex at a flat
rate of $4,400 per
month per camera location. The timing of the
amendment coincided with the
failure of SB 1325, a 2008 bill that would have allowed
the use of
photo radar throughout California. (In 2006, 2008,
2009 and 2010 there were legislative efforts to allow
photo radar. They failed, but photo radar is an idea
that won't go away - a new bill was launched in Mar. 2011.
See Legislation.)
In June 2012 the MRCA extended the
contract for four years, and got the price down to $3900
per camera per month for the first two years and $3750
for the remaining two years.
In March 2015 a bill prohibiting the
use of stop sign cameras was introduced in the
California legislature - but it did not pass. Read
about SB 218 on the Action/Legis page.
In June 2016 the MRCA again extended
the contract for four years - to 2020 - and got the
price down to $3500 per camera per month.
The contract information above was up-to-date as of Oct.
24, 2016.
MRCA Docs Set # 4
More
Coming
There may be some
more MRCA information posted in the next few
weeks. Mark your calendar to remind you to come
back here and look!
---------------------------------
RED LIGHT CAMERAS
www.highwayrobbery.net
www.highwayrobbery.net