If
you haven't already done so, please read the
Garden Grove section on the Camera Towns page
Garden Grove Docs Set # 2
Signal Timing Charts & Speed Surveys
Updated 6-3-15
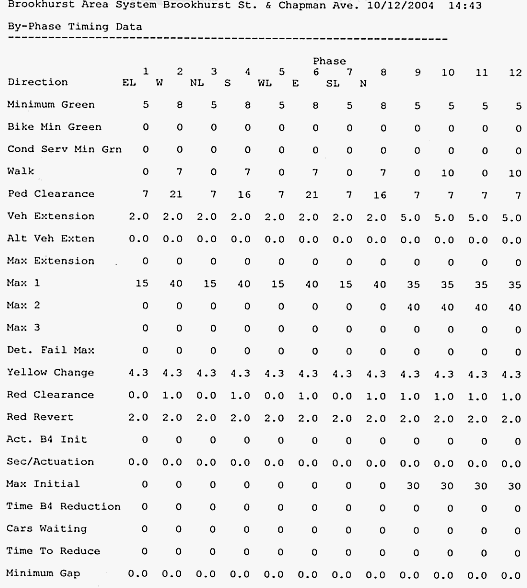
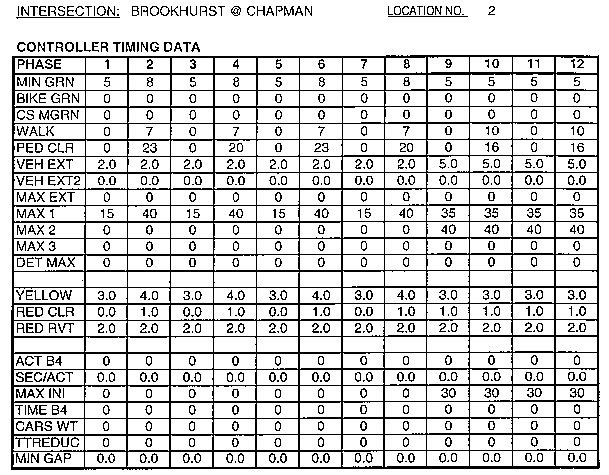
From Oct. 14, 2004 to Nov. 13, 2004 I had the following statement posted here: "In Garden Grove, the yellows for left turns are set at the same length as the yellows for straight ahead movements." That statement, while technically correct, was misleading. A re-examination of the timing charts I received in mid-October shows that while at that time all "existing" left-yellows were 4.0 or 4.3, the same as the "existing" yellows for the straight-ahead movements, as of Jan. 1, 2004 all the left-yellows were 3.0 seconds. The ticket counts in Set # 1 (on the main GG page) reveal a dramatic drop after May, so that probably is when the left-yellows were lengthened.
Also, the same re-examination of the timing charts revealed that the yellows for all through movements at Brookhurst / Chapman were increased, from 4.0 up to 4.3, sometime between Jan. 1 and Oct. 12, 2004. The 4.3-second setting is the minimum required in a 45-mph zone, which Brookhurst near Chapman is.
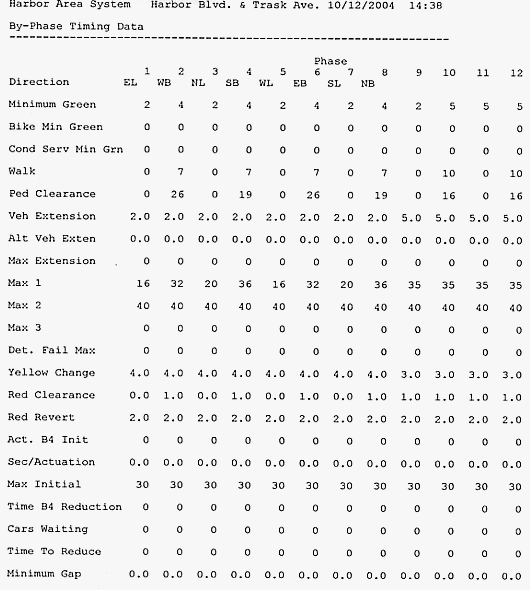
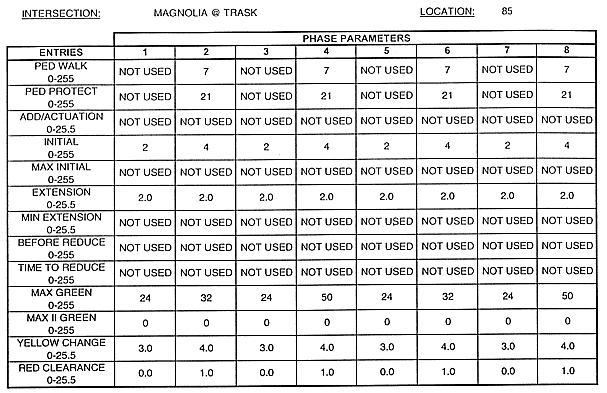
In Garden Grove, the yellows for left turns now are set at the same length as the yellows for straight ahead movements. But they were very short as recently as April or May of 2004. Here are the current, and old, timing charts I received on Oct. 14, 2004.
The chart below was current, as of Oct. 14, 2004.
When I received it on Oct. 14, 2004, the chart below bore a handwritten note: "Timing as of Jan. 1, 2004 and before." But the settings given may have remained in effect until April or May of 2004.
The chart below was current, as of Oct. 14, 2004.
When I received it on Oct. 14, 2004, the chart below bore a handwritten note: "Timing as of Jan. 1, 2004 and before." But the settings given may have remained in effect until April or May of 2004.
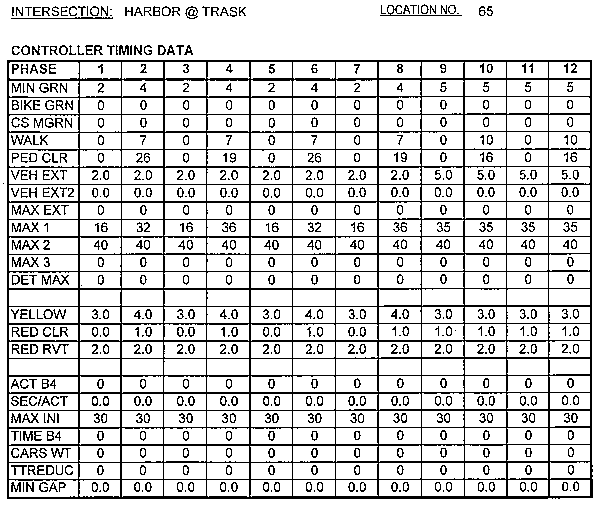
Magnolia and Trask: The chart below was current, as of Oct. 14, 2004.
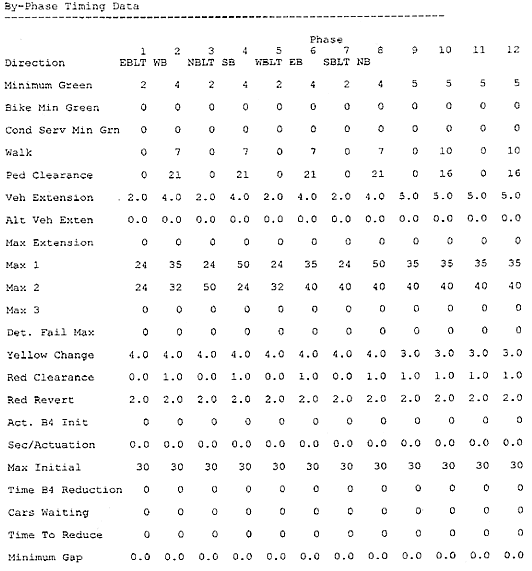
When I received it on Oct. 14, 2004, the chart below bore a handwritten note: "Timing as of Jan. 1, 2004 and before." But the settings given may have remained in effect until April or May of 2004.
Ten+ Years Later
Here are signal timing charts received in Aug. 2014.
Here are speed surveys and signal timing charts received in Apr. 2015. (Big file)
Here are timing charts received in June 2018.
City staff reported that these three intersections were the only camera-enforced intersections to have signal timing changes after 8-1-17.
---------------------------------
RED LIGHT CAMERAS
www.highwayrobbery.net
www.highwayrobbery.net