If
you
haven't
already done so, please read the Loma Linda
section on the Camera
Towns
page
Loma
Linda
Documents
Some of Loma Linda's tickets can
possibly be
ignored.
If your "ticket" does not have the Superior
Court's name and
address on it, it is what I call a "Snitch Ticket."
For more
details, see the Snitch Ticket
section on the Your Ticket page and Set
#
1, below.
Loma
Linda Docs
Set # 1
Ticket
Counts
Total
Violations,
Notices Printed [4]
| Cam # |
ANBA 01 |
BAAN 01 |
BAMO 01 |
MOBA 01 |
REAN 01 |
REAN 03 |
REMO 01 |
|
|
|
| Ander- son Sbd @ Barton [6] |
Barton Ebd @ Ander- son [6] |
Barton Ebd @ Mt. View |
Mt. View Sbd @ Barton |
Red- lands Wbd @ Ander- son |
Red- lands Ebd @ Ander- son |
Red- lands Ebd @ Mt. View |
Total Citations Issued as % of Events Recorded |
Total Violations Recorded/ Notices Printed [1] [4] |
||
| Dec05 |
||||||||||
| 2005 |
||||||||||
| Jan06 |
335 211 |
442 355 |
241 162 |
691 345 |
496 318 |
313 229 |
207 124 |
2725 1744 |
||
| Feb06 |
280 126 |
347 269 |
166 97 |
594 228 |
334 174 |
309 206 |
256 149 |
2286 1249 |
||
| Mar06 |
252 146 |
309 243 |
176 123 |
588 224 |
246 125 |
215 125 |
321 172 |
2107 1158 |
||
| Apr06 |
241 127 |
349 270 |
147 93 |
424 171 |
349 206 |
212 132 |
249 145 |
1971 1144 |
||
| May06 |
244 148 |
336 263 |
204 130 |
545 230 |
409 236 |
307 196 |
245 139 |
2290 1342 |
||
| Jun06 |
205 70 |
274 188 |
167 82 |
512 146 |
392 215 |
201 121 |
193 76 |
1944 898 |
||
| Jul06 |
173 85 |
286 193 |
135 69 |
527 190 |
310 170 |
147 95 |
216 144 |
1794 946 |
||
| Aug06 [5] |
177 96 |
353 269 |
150 91 |
472 210 |
375 230 |
187 116 |
218 147 |
1932 1159 |
||
| Sep06 [5] |
204 101 |
270 176 |
144 71 |
411 179 |
338 181 |
195 113 |
200 128 |
1762 949 |
||
| Oct06 [5] |
228 101 |
368 261 |
151 77 |
423 221 |
365 211 |
213 112 |
208 132 |
1956 1115 |
||
| Nov06 [5] |
192 102 |
199 142 |
104 62 |
388 209 |
334 213 |
163 101 |
172 120 |
1552 949 |
||
| Dec06 [5] |
168 98 |
111 82 |
51 21 |
302 117 |
302 203 |
130 94 |
92 56 |
1156 671 |
||
| 2006 |
||||||||||
| Jan07 |
180 89 |
166 125 |
34 15 |
244 114 |
228 136 |
93 62 |
82 50 |
1027 591 |
||
| Feb07 [7] |
||||||||||
| Jul07 |
138 81 |
124 83 |
27 11 |
239 166 |
160 85 |
76 43 |
145 92 |
909 561 |
||
| 2007 |
||||||||||
| Jan08 |
106 77 |
106 85 |
29 10 |
219 162 |
116 72 |
69 53 |
42 19 |
687 478 |
||
| Jul08 |
81 46 |
77 50 |
22 4 |
240 110 |
127 60 |
61 32 |
44 23 |
652 325 |
||
| 2008 |
||||||||||
| Jan09 |
214 78 |
104 61 |
82 15 |
524 135 |
130 81 |
49 23 |
19 13 |
1122 406 |
||
| Jul09 |
158 66 |
130 80 |
25 2 |
504 140 |
165 79 |
28 12 |
37 14 |
1047 393 |
||
| Oct09 |
202 77 |
98 62 |
22 5 |
791 132 |
66 6 |
31 11 |
35 15 |
1245 308 |
||
| Nov09 |
127 70 |
51 36 |
29 16 |
456 178 |
60 20 |
27 10 |
14 4 |
764 334 |
||
| Dec09 |
69 36 |
21 5 |
17 8 |
367 169 |
24 7 |
11 6 |
5 2 |
514 233 |
||
| 2009 |
||||||||||
| Jan10 |
60 35 |
20 7 |
16 2 |
304 95 |
19 6 |
10 3 |
22 9 |
451 157 |
||
| Feb10 |
54 35 |
22 9 |
16 4 |
267 98 |
12 2 |
11 5 |
33 10 |
415 163 |
||
| Mar10 |
147 62 |
9 0 |
19 9 |
355 122 |
37 11 |
15 5 |
12 6 |
594 215 |
||
| Apr10 [5] |
246 95 |
0 0 |
13 2 |
345 105 |
27 5 |
13 5 |
10 4 |
654 216 |
||
| May10 [5] |
225 81 |
15 8 |
12 5 |
244 78 |
29 12 |
27 6 |
9 2 |
561 192 |
||
| Jun10 [5] |
136 48 |
21 10 |
18 3 |
345 127 |
30 6 |
20 10 |
10 4 |
580 208 |
||
| Jul10 [5] |
223 92 |
13 7 |
16 4 |
527 184 |
38 6 |
19 8 |
15 5 |
851 306 |
||
| Aug10 [7] |
||||||||||
| Sep10 [7] |
||||||||||
| Oct10 [7] |
||||||||||
| Nov10 |
||||||||||
| Dec10 [8] |
||||||||||
| 2010 |
||||||||||
| Cam # |
ANBA 01 |
BAAN 01 |
BAMO 01 |
MOBA 01 |
REAN 01 |
REAN 03 |
REMO 01 |
|
|
|
| Ander- son Sbd @ Barton [6] |
Barton Ebd @ Ander- son [6] |
Barton Ebd @ Mt. View |
Mt. View Sbd @ Barton |
Red- lands Wbd @ Ander- son |
Red- lands Ebd @ Ander- son |
Red- lands Ebd @ Mt. View |
Total Citations Issued as % of Events Recorded |
Total Violations Recorded/ Notices Printed [1] [4] |
This table made by highwayrobbery.net, using official reports provided by the City under the California Public Records Act.
Official reports, Jan05 - Apr10
Official reports, Aug06 - Dec06 & Apr10 - Jul10
[ ] indicates a footnote.
[1] Totals are as provided by the City.
[2] YTD = Year-to-date total.
[3] Un-used columns are to allow for later expansion of City's system.
[4] Any figures in red type (or, if you are looking at this table in black and white, the upper figure when there are two or more figures in a cell) are what RedFlex calls Total Violations, or all incidents recorded by the cameras, and due to time limitations may have been posted here only for selected months or locations. If there is sufficient public interest, the remaining months will be posted. The figures in black type are what RedFlex calls Notices Printed, and represent the sum of genuine citations issued (those filed with the court) plus any Nominations mailed (not filed with the court, a.k.a. Snitch Tickets).
[5] Monthly data was requested on 8-17-10, was received on 10-5-10, and was posted here on 10-7-10.
[6] The camera enforcement is at the named intersection, but the direction of enforcement (north, south, east, west) is not yet 100% confirmed.
[7] Data was requested on 10-6-10.
[8] The program closed on 12-1-10.
"Late Time" Graphs
The City provided bar graphs (or "bar charts") of Late Times, etcetera, for all of its cameras.
These graphs track violations recorded, not tickets issued.
Where there is a large number of long Late Time violations in a curb lane, it is believed to indicate heavy ticketing on right turns.
(The curb lane will be the lane with the highest lane number.)
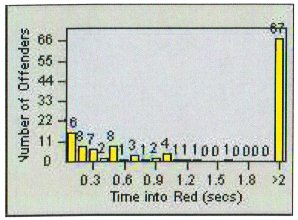
The picture above is an example from another city.
ANBA-01, March 2006
ANBA-01, Oct. 2006
ANBA-01, Nov. 2006
ANBA-01, Dec. 2006
ANBA-01, Oct. 2009
ANBA-01, March 2010
BAAN-01, March 2006
BAAN-01, Oct. 2006
BAAN-01, Nov. 2006
BAAN-01, Dec. 2006
BAAN-01, Oct. 2009
BAAN-01, March 2010
BAMO-01, March 2006
BAMO-01, Oct. 2006
BAMO-01, Nov. 2006
BAMO-01, Dec. 2006
BAMO-01, Oct. 2009
BAMO-01, March 2010
MOBA-01, March 2006
MOBA-01, Oct. 2006
MOBA-01, Nov. 2006
MOBA-01, Dec. 2006
MOBA-01, Oct. 2009
MOBA-01, March 2010
REAN-01, March 2006
REAN-01, Oct. 2006
REAN-01, Nov. 2006*
REAN-01, Dec. 2006
REAN-01, Oct. 2009
REAN-01, March 2010
REAN-03, March 2006
REAN-03, Oct. 2006
REAN-03, Nov. 2006*
REAN-03, Dec. 2006
REAN-03, Oct. 2009
REAN-03, March 2010
REMO-01, March 2006*
REMO-01, Oct. 2006
REMO-01, Nov. 2006*
REMO-01, Dec. 2006
REMO-01, Oct. 2009
REMO-01, March 2010
*The City was unable to provide these bar graphs.
Bar graphs are available for other cities, too - see the list in the expanded version of Defect # 9.
Loma Linda Docs Set
# 3
Yellows
Too
Short: 1890 to 4000 Unjustified Tickets
New 9-12-10, updated 12-6-10
On Sept. 9, 2010 the Inland Empire Weeky
published an article
about too-short yellows in Loma Linda, quoting
highwayrobbery.net.
The City officials quoted in the
article
said that Loma Linda's yellows have always been long
enough.
In a later article (Oct. 13) in the San Bernardino Sun, reporter Ryan Hagen wrote:
Here is how highwayrobbery.net
discovered, contrary
to the officials' claims, that the yellows were too
short during the
first ten months of the camera program's operation.
Highwayrobbery.net's estimate of the
number
of unjustified
tickets is 1890 to 4000. See details below the
table.
Table: Loma Linda Yellow Times
| Signal |
Date of Timing Change |
Sbd Left |
Nbd Thru |
Wbd Left |
Ebd Thru |
Nbd Left |
Sbd Thru |
Ebd Left |
Wbd Thru |
| Anderson/Barton | 3-14-05 |
3.0 |
4.0 |
3.0 |
4.0 |
3.0 |
4.0 |
3.0 |
4.0 |
| 11-20-06 |
3.0 |
3.6 |
3.0 |
4.3 |
3.0 |
3.6 |
3.0 |
4.3 |
|
| 10-29-08 |
3.0 |
3.6 |
3.0 |
4.3 |
3.0 |
3.6 |
3.0 |
4.3 |
|
| 6-11-10 |
4.0 |
4.6 |
4.0 |
5.3 |
4.0 |
4.6 |
4.0 |
5.3 |
|
| Mt. View/Barton |
3-14-05 |
3.0 |
4.0 |
4.0 |
4.0 |
3.0 |
4.0 |
4.0 |
4.0 |
| 11-20-06 |
3.0 |
4.0 |
4.0 |
4.3 |
3.0 |
4.0 |
4.0 |
5.0 |
|
| 5-8-07 |
3.0 |
4.0 |
4.0 |
5.0 |
3.0 |
4.0 |
4.0 |
5.0 |
|
| 10-29-08 |
3.0 |
4.0 |
4.0 |
5.0 |
3.0 |
4.0 |
4.0 |
5.0 |
|
| 11-24-09 |
4.0 |
5.0 |
5.0 |
6.0 |
4.0 |
5.0 |
5.0 |
6.0 |
|
| 1-7-10 |
4.0 |
5.0 |
5.0 |
6.0 |
4.0 |
5.0 |
5.0 |
6.0 |
|
| Anderson/Redlands |
3-14-05 |
3.0 |
4.0 |
3.0 |
4.0 |
3.0 |
4.0 |
3.0 |
4.0 |
| 11-20-06 |
3.0 |
3.6 |
3.0 |
4.3 |
3.0 |
3.6 |
3.0 |
4.3 |
|
| 4-3-08 |
3.0 |
3.6 |
3.0 |
4.3 |
3.0 |
3.6 |
3.0 |
4.3 |
|
| 11-24-09 |
4.0 |
4.6 |
4.0 |
5.3 |
4.0 |
4.6 |
4.0 |
5.3 |
|
| Mt. View/Redlands | 2005 (not received
yet) |
? |
|||||||
| 11-20-06 |
3.5 |
4.0 |
3.5 |
4.3 |
3.5 |
4.0 |
3.5 |
4.3 |
|
| 1-6-09 |
3.5 |
4.0 |
3.5 |
4.3 |
3.5 |
4.0 |
3.5 |
4.3 |
|
| 6-11-10 |
4.5 |
5.0 |
4.5 |
5.3 |
4.5 |
5.0 |
4.5 |
5.3 |
|
The table above was compiled by
highwayrobbery.net, from signal
timing
charts obtained from the City, under a public
records act
request.
BARTON / ANDERSON:
Loops are: Ebd, with none in the right turn lane, and Sbd.
The Ebd cam is believed to be BAAN, and the Sbd cam ANBA,
but it could
be vice-versa.
The "thru" yellow for Ebd Barton was 4.0 until Nov. 2006
when it was
raised to
4.3. Thus, it was too short during the first 10+ months of
operation.
The yellow for Sbd Anderson is believed to have been at or
above the
legal minimum all
along.
The bar charts above (see Loma Linda Docs Set # 2)
were used to
estimate the number of tickets issued due to the too short
Ebd yellow.
For
purposes of this estimate, it was assumed that the Ebd cam
is BAAN. The
too-short yellow would have affected only the thru
movements, which
Redflex designated as lanes 2 and 3. (Lane 1 left turns
were excluded
as
the legal minimum for turns is 3.0. But it should be noted
that there
is an argument that if ANY yellow at a cam is too short,
then ALL
tickets issued by that cam are no good - including the
tickets for
turning movements.) The Mar. 2006 bar charts show that in
lanes 2 and 3
there were 86 violations of 0.3 or less, which if approved
for issuance
at the overall rate for that cam for the month, would have
resulted in
68 unjustified tickets, or 680 in ten months.
BARTON / MT. VIEW:
Loops are: Ebd, with none in the right turn lane, and Sbd,
maybe not
including the far right turn lane. (The bar charts for
MOBA show high
numbers of right turn tickets, while a site inspection
revealed that
a car making a right turn there from the unmarked lane
right next to
the curb would not pass over loops. Because a lot of right
turns were
detected by the camera, many cars must have been making a
right turn
while straddling the rightmost thru lane - which has
loops).
The Ebd cam is BAMO.
The yellow for Ebd Barton was 4.0 until Nov. 2006 when it
was raised to
4.3. Thus, it was too short during the first 10+ months of
operation.
The yellow for Sbd Mt. View is believed to have been at or
above the
legal minimum all
along.
The too-short Ebd yellow would have affected only the thru
movements,
which
Redflex designated as lanes 3 and 4 (the dual left turns
are lanes 1
and 2). The Mar. 2006 bar charts show that in lanes 3 and
4 there were
63
violations of 0.3 or less, which if approved for issuance
at the
overall rate for that cam for the month, would have
resulted in 44
unjustified tickets, or 440 in ten months.
REDLANDS / ANDERSON:
Loops are: Ebd and Wbd. No loops were visible under the
Wbd far right
turn lane.
The Wbd cam is REAN-01 and the EBd cam is REAN-03.
The yellow for Ebd and Wbd Redlands was 4.0 until Nov.
2006 when it was
raised to 4.3. Thus, it was too short during the first 10+
months of
operation.
The too-short yellow would have affected only the thru
movements, which
Redflex designated as lanes 2 and 3. The Mar. 2006 bar
charts show that
in lanes 2 and 3 for Wbd Redlands (REAN-01) there were 30
violations of
0.3 or less, which if approved for issuance at the overall
rate for
that intersection for the month, would have resulted in 15
unjustified
tickets, or 150 in ten months.
The Mar. 2006 bar charts show that in
lanes 2 and 3 for Ebd Redlands (REAN-03) there were 33
violations of
0.3 or less, which if approved for issuance at the overall
rate for
that cam for the month, would have resulted in 19
unjustified tickets,
or 190 in ten months.
REDLANDS / MT. VIEW:
Loops are: Ebd, with none in the right turn lane.
The Ebd cam is REMO.
The signal timing chart covering the period prior to
Nov. 2006 has not yet been received (it was requested on
June 10, again
on June 28, again on Aug. 17, and again on Dec. 6), so we
do not know
for sure that the
Ebd yellow was too short
during the first 10+ months of operation. But it is
likely.
If it was too short, it would have affected only the thru
movements,
which Redflex designated as lanes 2 and 3. The Oct06
bar charts (received 10-5-10) show that in lanes 2
and 3 there
were 67 violations of 0.3 or less, which if approved for
issuance at
the overall rate for that cam for the month, would have
resulted in 43
unjustified tickets, or 430 in ten months.
TOTAL (EST.) UNJUSTIFIED TICKETS AT THE FIVE EAST - WEST
CAMERAS IN TEN
MONTHS:
Per the estimating method detailed above
(posted here
on 9-12-10, and updated on 10-8-10 after the Oct. 2006
REMO bar charts
were received), 1890 tickets were unjustified.
But it could be much higher. The Aug. -
Dec.
2006 ticket counts
received on 10-5-10 show that after the 11-20-06
correction of yellow
times, ticketing decreased by 400 per month, an (est.)
4000 unjustified
tickets in ten months.
Loma Linda Docs Set # 4
The Contract,
Etc.
The contract was allowed to expire, and
the
program was closed on Dec. 1, 2010.
This list of contracts and amendments may not be
up-to-date - there could be a
contract or amendment later than the ones listed above.
Loma Linda
Docs Set
# 5
Longer
Yellows:
Effect on Ticket Volume
This spreadsheet
shows how Loma Linda's longer yellows
affected ticket volume.
SaferStreetsLA
Report on Effect of Longer Yellows in Loma Linda
Loma Linda Docs Set
# 6
More
Coming
There may be some
more Loma Linda
information
posted in the next few
weeks. Mark
your calendar to remind you to come back here
and look!
---------------------------------
RED LIGHT CAMERAS
www.highwayrobbery.net
www.highwayrobbery.net