If
you haven't already done so, please read the Santa
Clarita section on the Camera Towns page
City of
Santa Clarita Documents
(and Information)
Program
ended March 31, 2015 - see Set # 3, below.
It is possible to completely ignore a Santa Clarita red light camera ticket.
1. If your "ticket" does not
have the Superior Court's name and address on it, it is
a fake ticket, which I call a "Snitch Ticket." For
more details about Snitch Tickets, see the Snitch Ticket
section at the top of the Your Ticket page.
2. The LA County Superior Court does not report
ignored red light camera tickets to the DMV. More
info is in "Countywide Information," which is Docs Set #
2 on the LA County
Documents page.
Do you live in LA County?
Was Zev Yaroslavsky your County
Supervisor? (Until Nov. 2014, he represented the
Third District, which includes the central and western
San Fernando Valley, Malibu, Santa Monica, Venice,
Beverly Hills, the City of West Hollywood, and part of
Hollywood.)

Sheila "Kuehl Kams" Kuehl, in 2007
During her career in the California
Legislature, Kuehl made three attempts to pass bills to allow
the use of automated speed enforcement (photo radar) in
California.
Kuehl will be up for re-election in Nov. 2018 and Nov. 2022.
City of
Santa Clarita Docs Set # 1
Ticket Counts
New 7-29-09, updated 4-30-15
Total Violations Recorded
(in red
type), Notices Printed, Left
Turn Violations Recorded [1] [4] [10]
| Cam # |
BCNR -01 |
BCSC -01 |
MMMB -01 |
NRBC -01 |
NRMB -01 |
OVLY -01 |
VAMB -01 |
VAMB -03 |
WCSC -01 |
WCSC -03 |
|
|
|
||
| Nbd Bou- quet & New- hall |
Ebd Bou- quet & Seco |
Ebd Magic Mtn. & Mc- Bean |
Ebd New- hall & Bou- quet |
Wbd New- hall & Mc- Bean |
Sbd Or- chard Vill. & Lyons |
Ebd Val- encia & Mc- Bean |
Wbd Val- encia & Mc- Bean |
Sbd Whites & Sol- edad |
Nbd Whites & Sol- edad |
|
Straight v. Right v. Left [15] |
Total Violations Recorded/ Notices Printed/ Left Turns [1] [4] [10] |
|||
| Jul04 [8] |
74 |
45 |
46 |
75 |
235 |
111 |
586 |
||||||||
| Aug04 [9] |
206 |
148 |
224 |
116 |
232 |
85 |
1011 |
||||||||
| Sep04 |
0 0 |
294 144 |
262 104 |
0 0 |
314 207 |
198 128 |
0 0 |
0 0 |
345 208 |
153 78 |
1566 869 |
||||
| Oct04 |
0 0 |
310 149 |
242 92 |
0 0 |
223 142 |
169 123 |
0 0 |
0 0 |
312 209 |
155 85 |
1411 800 |
||||
| Nov04 |
0 0 |
213 104 |
197 81 |
0 0 |
127 69 |
120 76 |
0 0 |
0 0 |
218 142 |
162 80 |
1037 552 |
||||
| Dec04 |
0 0 |
183 107 |
222 113 |
0 0 |
145 76 |
135 94 |
0 0 |
0 0 |
195 138 |
137 75 |
1017 603 |
||||
| 2004 |
|||||||||||||||
| Jan05 |
0 0 |
173 88 |
164 64 |
0 0 |
79 43 |
102 58 |
0 0 |
0 0 |
256 167 |
115 56 |
889 476 |
||||
| Apr05 |
0 0 |
246 136 |
275 151 |
0 0 |
128 75 |
109 72 |
0 0 |
0 0 |
181 130 |
133 73 |
1072 637 |
||||
| Jul05 |
0 0 |
185 56 |
270 111 |
0 0 |
61 14 |
58 26 |
0 0 |
0 0 |
124 69 |
118 46 |
816 322 |
||||
| Oct05 |
0 0 |
227 100 |
266 101 |
0 0 |
138 58 |
101 46 |
0 0 |
0 0 |
93 55 |
112 42 |
937 402 |
||||
| 2005 [1] |
0 (Proj.) |
1140 (Proj.) |
1281 (Proj.) |
0 (Proj.) |
570 (Proj.) |
606 (Proj.) |
0 (Proj.) |
0 (Proj.) |
1263 (Proj.) |
651 (Proj.) |
5511 (Proj.) |
||||
| Jan06 |
0 0 |
114 41 |
122 61 |
0 0 |
73 47 |
58 41 |
0 0 |
0 0 |
74 43 |
87 38 |
528 271 |
||||
| Apr06 |
0 0 |
90 33 |
156 77 |
0 0 |
120 62 |
75 37 |
0 0 |
0 0 |
73 52 |
84 37 |
598 298 |
||||
| Jul06 |
0 0 |
117 39 |
189 83 |
0 0 |
32 13 |
58 29 |
27 5 |
12 0 |
97 48 |
63 33 |
596 250 |
||||
| Oct06 |
196 0 |
173 50 |
143 35 |
58 27 |
56 15 |
76 46 |
710 391 |
198 84 |
106 58 |
75 23 |
1791 729 |
||||
| 2006 [1] |
0 (Proj.) |
489 (Proj.) |
768 (Proj.) |
81 (Proj.) |
411 (Proj.) |
459 (Proj.) |
1188 (Proj.) |
252 (Proj.) |
603 (Proj.) |
393 (Proj.) |
4644 (Proj.) |
||||
| Jan07 |
32 0 |
118 46 |
101 48 |
57 30 |
40 21 |
80 43 |
378 280 |
160 84 |
70 42 |
65 15 |
1101 609 |
||||
| Apr07 |
247 50 |
141 48 |
110 30 |
61 9 |
49 22 |
77 41 |
331 172 |
203 51 |
76 44 |
70 14 |
1365 481 |
||||
| Jul07 |
309 95 |
157 60 |
134 57 |
104 36 |
32 14 |
54 24 |
368 207 |
145 41 |
54 38 |
55 20 |
1412 592 |
||||
| Oct07 |
0 0 |
0 0 |
73 22 |
65 42 |
41 23 |
99 53 |
385 261 |
215 101 |
107 60 |
90 23 |
1075 585 |
||||
| 2007 [1] |
435 (Proj.) |
462 (Proj.) |
471 (Proj.) |
351 (Proj.) |
240 (Proj.) |
483 (Proj.) |
2760 (Proj.) |
831 (Proj.) |
552 (Proj.) |
216 (Proj.) |
6801 (Proj.) |
||||
| Jan08 |
246 99 |
85 33 |
62 41 |
41 27 |
37 21 |
67 46 |
245 209 |
120 57 |
48 31 |
55 20 |
1006 584 |
||||
| Feb08 |
3 2 |
115 33 |
80 44 |
42 26 |
29 17 |
69 38 |
360 282 |
107 38 |
57 31 |
53 17 |
915 528 |
||||
| Mar08 |
345 140 |
109 32 |
85 27 |
75 39 |
40 18 |
72 48 |
434 300 |
103 45 |
53 28 |
63 23 |
1379 700 |
||||
| Apr08 |
353 127 |
107 28 |
78 35 |
37 19 |
37 24 |
53 27 |
367 189 |
118 39 |
43 21 |
52 20 |
1245 529 |
||||
| May08 |
375 123 |
103 24 |
77 32 |
55 24 |
79 38 |
83 22 |
469 224 |
119 39 |
48 27 |
32 8 |
1440 561 |
||||
| Jun08 |
332 128 |
124 52 |
86 42 |
68 26 |
68 33 |
51 19 |
364 159 |
121 35 |
53 36 |
112 45 |
1379 575 |
||||
| Jul08 |
333 103 |
80 26 |
68 22 |
68 25 |
49 18 |
49 13 |
354 126 |
134 22 |
55 28 |
35 12 |
1225 395 |
||||
| Aug08 |
287 105 |
58 19 |
42 8 |
56 17 |
38 15 |
51 22 |
354 164 |
54 14 |
63 37 |
55 12 |
1058 413 |
||||
| Sep08 |
277 82 |
66 12 |
44 8 |
56 26 |
65 25 |
88 49 |
312 165 |
0 0 |
69 44 |
56 14 |
1033 425 |
||||
| Oct08 |
249 90 |
142 51 |
0 0 |
49 19 |
86 49 |
55 31 |
396 256 |
0 0 |
89 52 |
58 22 |
1124 570 |
||||
| Nov08 |
218 110 |
77 17 |
0 0 |
40 14 |
68 37 |
71 45 |
374 286 |
0 0 |
58 33 |
31 16 |
937 558 |
||||
| Dec08 |
224 88 |
71 11 |
51 33 |
39 14 |
72 29 |
55 27 |
484 338 |
0 0 |
63 42 |
46 11 |
1105 593 |
||||
| 2008 [1] |
1197 |
338 |
292 |
276 |
324 |
387 |
2698 |
289 |
410 |
220 |
6431 |
||||
| Jan09 |
141 67 |
63 14 |
45 22 |
32 11 |
64 34 |
42 24 |
309 246 |
0 0 |
44 31 |
44 10 |
784 459 |
||||
| Feb09 |
107 41 |
54 9 |
36 14 |
26 11 |
50 21 |
48 26 |
268 194 |
14 7 |
69 33 |
38 9 |
710 365 |
||||
| Mar09 |
136 63 |
59 17 |
65 26 |
41 23 |
41 15 |
41 17 |
346 268 |
118 49 |
79 50 |
41 8 |
967 536 |
||||
| Apr09 |
165 53 |
58 7 |
47 16 |
37 10 |
73 26 |
46 13 |
362 228 |
99 30 |
66 39 |
34 9 |
987 431 |
||||
| May09 |
145 54 |
70 24 |
67 30 |
43 19 |
75 39 |
60 31 |
357 263 |
119 49 |
84 51 |
55 23 |
1075 583 |
||||
| Jun09 |
140 57 |
70 17 |
28 17 |
34 16 |
75 36 |
30 8 |
552 357 |
122 38 |
54 27 |
42 17 |
1147 590 |
||||
| Jul09 |
156 71 |
64 13 |
76 35 |
44 21 |
40 16 |
45 25 |
311 195 |
158 41 |
70 18 |
38 17 |
1002 452 |
||||
| Aug09 |
111 49 |
78 25 |
107 41 |
36 16 |
82 38 |
33 22 |
275 190 |
117 35 |
82 53 |
43 11 |
964 480 |
||||
| Sep09 |
199 81 |
70 29 |
74 46 |
46 28 |
92 60 |
55 25 |
0 0 |
115 45 |
86 54 |
36 12 |
773 380 |
||||
| Oct09 |
186 81 |
68 23 |
75 13 |
56 30 |
84 23 |
40 22 |
184 140 |
145 51 |
81 51 |
35 9 |
954 443 |
||||
| Nov09 |
191 109 |
66 18 |
39 26 |
39 21 |
26 5 |
40 28 |
319 266 |
117 47 |
61 42 |
41 11 |
939 573 |
||||
| Dec09 |
144 85 |
63 13 |
37 19 |
56 26 |
93 64 |
33 19 |
339 273 |
120 51 |
66 38 |
31 1 |
982 589 |
||||
| 2009 [1] |
811 |
209 |
305 |
232 |
377 |
260 |
2620 |
443 |
487 |
137 |
5881 |
||||
| 2010 [10] 1st Qtr. Left Turn Violations |
359 [10] 311 |
147 [10] 118 |
124 [10] 124 |
208 [10] 208 |
216 [10] 216 |
161 [10] 161 |
743 [10] 740 |
288 [10] 264 |
122 [10] 122 |
59 [10] 56 |
2427 [10] 2320 |
||||
| Jan10 |
80 33 |
47 22 |
37 13 |
49 33 |
60 37 |
42 21 |
217 173 |
98 32 |
37 23 |
22 10 |
689 397 |
||||
| Feb10 |
99 57 |
41 14 |
47 14 |
72 53 |
61 40 |
50 25 |
215 179 |
93 34 |
47 36 |
26 11 |
751 463 |
||||
| Mar10 |
170 84 |
57 13 |
40 18 |
85 60 |
95 68 |
65 38 |
307 246 |
94 35 |
37 25 |
9 5 |
959 592 |
||||
| Apr10 |
64 26 |
15 6 |
53 25 |
67 12 |
163 121 |
43 22 |
258 201 |
80 28 |
0 0 |
2 1 |
745 442 |
||||
| May10 |
69 25 |
57 14 |
67 39 |
68 23 |
164 122 |
41 20 |
266 207 |
63 28 |
25 20 |
6 4 |
826 502 |
||||
| Jun10 |
77 36 |
63 25 |
53 22 |
71 27 |
175 129 |
33 20 |
230 159 |
78 17 |
38 27 |
19 12 |
837 474 |
||||
| Jul10 |
65 19 |
63 27 |
65 29 |
64 27 |
155 98 |
38 16 |
193 136 |
100 34 |
55 34 |
23 13 |
821 433 |
||||
| Aug10 |
69 24 |
72 27 |
66 36 |
79 32 |
157 107 |
37 22 |
228 164 |
91 28 |
66 53 |
27 11 |
892 504 |
||||
| Sep10 |
57 19 |
71 22 |
47 19 |
65 27 |
166 117 |
41 25 |
220 161 |
80 23 |
79 65 |
22 12 |
848 490 |
||||
| Oct10 |
57 17 |
86 42 |
39 21 |
69 34 |
124 78 |
55 30 |
195 153 |
77 31 |
58 45 |
0 0 |
760 451 |
||||
| Nov10 |
49 13 |
53 20 |
52 24 |
56 29 |
120 88 |
42 21 |
195 155 |
79 32 |
52 40 |
30 11 |
728 433 |
||||
| Dec10 |
63 21 |
56 29 |
52 32 |
71 44 |
139 106 |
34 17 |
245 196 |
99 33 |
60 40 |
43 24 |
862 542 |
||||
| 2010 [1] |
374 |
261 |
292 |
401 |
1111 |
277 |
2130 |
355 |
408 |
114 |
5723 |
||||
| Jan11 |
14 2 |
50 24 |
39 16 |
61 28 |
110 81 |
44 23 |
161 128 |
80 24 |
43 24 |
33 23 |
635 373 |
||||
| Feb11 |
44 7 |
55 23 |
38 16 |
49 28 |
105 74 |
38 17 |
216 169 |
84 37 |
46 31 |
37 19 |
712 421 |
||||
| Mar11 |
70 29 |
84 32 |
50 23 |
55 27 |
109 77 |
46 27 |
271 211 |
70 20 |
63 53 |
37 20 |
855 519 |
||||
| Apr11 |
81 26 |
57 25 |
63 27 |
65 30 |
82 56 |
38 24 |
270 197 |
125 44 |
54 34 |
29 15 |
864 478 |
||||
| May11 |
54 10 |
77 33 |
58 23 |
56 21 |
103 65 |
51 18 |
289 197 |
99 22 |
64 45 |
35 18 |
886 452 |
||||
| Jun11 |
47 12 |
73 29 |
64 27 |
79 17 |
110 78 |
32 12 |
263 169 |
91 12 |
42 30 |
36 15 |
837 401 |
||||
| Jul11 |
47 11 |
75 23 |
73 34 |
64 20 |
104 59 |
32 9 |
258 169 |
83 16 |
48 33 |
27 13 |
811 387 |
||||
| Aug11 |
51 16 |
74 35 |
75 37 |
59 23 |
116 70 |
36 14 |
199 134 |
90 20 |
69 51 |
41 22 |
810 422 |
||||
| Sep11 |
74 20 |
95 45 |
52 30 |
46 17 |
129 84 |
75 43 |
273 187 |
116 40 |
99 64 |
26 17 |
985 547 |
||||
| Oct11 |
83 33 |
95 52 |
72 41 |
43 29 |
54 30 |
74 45 |
353 289 |
109 36 |
111 86 |
28 12 |
1022 653 |
||||
| Nov11 |
78 38 |
73 50 |
51 26 |
0 0 |
0 0 |
52 30 |
344 292 |
85 31 |
98 65 |
35 21 |
816 553 |
||||
| Dec11 |
87 26 |
91 49 |
85 52 |
30 8 |
58 39 |
67 27 |
393 334 |
136 59 |
67 45 |
56 38 |
1070 677 |
||||
| 2011 [1] |
230 |
420 |
352 |
248 |
713 |
289 |
2476 |
361 |
561 |
233 |
5883 |
||||
| Jan12 |
69 31 |
75 41 |
61 36 |
31 22 |
53 41 |
59 17 |
241 191 |
109 40 |
70 41 |
32 20 |
800 480 |
||||
| Feb12 |
64 30 |
83 42 |
68 39 |
35 26 |
54 37 |
67 22 |
350 271 |
126 40 |
84 64 |
26 18 |
957 589 |
||||
| Mar12 |
82 31 |
101 49 |
68 38 |
45 29 |
63 49 |
53 34 |
414 321 |
122 48 |
85 65 |
54 30 |
1087 694 |
||||
| Apr12 |
88 44 |
75 47 |
70 43 |
52 26 |
75 54 |
69 27 |
370 276 |
106 39 |
107 75 |
24 16 |
1036 647 |
||||
| May12 |
84 36 |
117 57 |
101 61 |
55 34 |
88 63 |
84 42 |
478 363 |
139 56 |
117 79 |
29 20 |
1292 811 |
||||
| Jun12 |
97 41 |
119 54 |
72 47 |
45 28 |
76 57 |
50 21 |
420 276 |
148 54 |
71 57 |
28 20 |
1126 655 |
||||
| Jul12 |
85 33 |
117 59 |
102 65 |
48 22 |
81 60 |
46 19 |
408 289 |
132 53 |
82 60 |
36 23 |
1137 683 |
||||
| Aug12 |
95 50 |
103 48 |
114 72 |
44 19 |
98 83 |
65 37 |
494 331 |
98 42 |
128 100 |
39 24 |
1278 806 |
||||
| Sep12 |
72 30 |
102 56 |
103 68 |
32 18 |
97 77 |
83 50 |
476 378 |
93 45 |
305 235 |
36 18 |
1399 975 |
||||
| Oct12 |
86 36 |
128 66 |
117 77 |
25 11 |
83 67 |
88 48 |
431 339 |
0 0 |
263 220 |
39 20 |
1260 884 |
||||
| Nov12 |
77 32 |
93 50 |
95 56 |
39 6 |
81 72 |
85 62 |
457 221 |
0 0 |
274 221 |
29 17 |
1230 882 |
||||
| Dec12 |
96 35 |
94 61 |
76 52 |
56 28 |
90 73 |
69 45 |
552 461 |
0 0 |
177 140 |
29 17 |
1226 913 |
||||
| 2012 [1] |
429 |
630 |
654 |
269 |
733 |
424 |
3717 |
417 |
1357 |
243 |
9019 |
||||
| Jan13 |
210 37 |
136 42 |
99 54 |
43 20 |
56 42 |
107 41 |
399 313 |
7 2 |
65 44 |
24 14 |
1146 609 |
||||
| Feb13 |
137 32 |
156 56 |
64 32 |
44 20 |
71 60 |
105 55 |
510 415 |
100 41 |
86 55 |
20 15 |
1293 781 |
||||
| Mar13 |
141 50 |
205 105 |
124 64 |
64 33 |
94 70 |
87 53 |
647 477 |
154 66 |
133 108 |
33 18 |
1682 1044 |
||||
| Apr13 |
15 5 |
204 109 |
114 63 |
76 34 |
108 80 |
115 65 |
611 436 |
145 53 |
127 89 |
24 16 |
1539 950 |
||||
| May13 |
162 53 |
205 100 |
145 79 |
76 27 |
106 83 |
114 55 |
658 430 |
152 47 |
140 111 |
25 12 |
1783 997 |
||||
| Jun13 [11] |
168 58 |
224 98 |
72 38 |
113 43 |
56 36 |
113 53 |
269 185 |
121 16 |
129 89 |
26 17 |
1291 633 |
||||
| Jul13 [11] |
153 44 |
213 94 |
45 21 |
165 45 |
49 31 |
78 38 |
76 39 |
110 20 |
127 81 |
18 12 |
1034 425 |
||||
| Aug13 |
207 46 |
216 79 |
70 31 |
129 51 |
39 22 |
132 55 |
104 47 |
114 16 |
137 91 |
37 28 |
1185 466 |
||||
| Sep13 |
192 69 |
234 97 |
41 15 |
135 42 |
55 46 |
115 59 |
155 104 |
98 18 |
157 111 |
47 26 |
1229 567 |
||||
| Oct13 |
214 64 |
244 91 |
80 31 |
128 51 |
57 39 |
127 72 |
143 105 |
113 24 |
148 99 |
58 39 |
1312 615 |
||||
| Nov13 |
200 52 |
223 78 |
67 31 |
107 36 |
61 47 |
79 19 |
133 102 |
134 14 |
125 90 |
56 28 |
1185 497 |
||||
| Dec13 |
154 41 |
174 71 |
70 30 |
98 39 |
66 52 |
53 15 |
125 91 |
118 28 |
116 69 |
58 40 |
1032 476 |
||||
| 2013 [1] [15] |
551 |
1020 |
489 |
441 |
608 |
580 |
2744 |
345 |
1037 |
265 |
S: 5075 R: 7 L: 1937 |
8060 |
|||
| Jan14 |
173 51 |
184 73 |
52 34 |
85 35 |
44 34 |
57 6 |
79 60 |
35 10 |
112 70 |
38 25 |
859 398 |
||||
| Feb14 [11] |
98 13 |
140 72 |
37 22 |
107 31 |
22 18 |
20 7 |
89 51 |
22 8 |
120 84 |
32 19 |
687 325 |
||||
| Mar14 |
95 43 |
228 132 |
51 34 |
134 69 |
17 12 |
39 13 |
33 20 |
12 3 |
93 71 |
55 36 |
757 433 |
||||
| Apr14 |
88 31 |
213 96 |
88 44 |
85 44 |
18 14 |
54 8 |
45 14 |
86 2 |
147 101 |
34 22 |
858 376 |
||||
| May14 |
117 49 |
246 118 |
78 51 |
166 94 |
25 16 |
40 12 |
45 18 |
103 11 |
115 80 |
40 24 |
975 473 |
||||
| Jun14 |
106 51 |
238 122 |
106 76 |
113 58 |
17 10 |
47 11 |
62 20 |
44 4 |
204 113 |
32 19 |
969 484 |
||||
| Jul14 |
67 24 |
229 128 |
73 36 |
76 38 |
16 11 |
52 12 |
50 19 |
85 8 |
198 122 |
46 28 |
892 426 |
||||
| Aug14 [13] |
48 14 |
276 146 |
93 37 |
48 20 |
15 10 |
34 12 |
56 25 |
81 8 |
164 100 |
24 13 |
[13] |
839 385 |
|||
| Sep14 |
51 14 |
309 148 |
82 34 |
45 11 |
25 14 |
72 20 |
70 34 |
107 14 |
158 105 |
27 20 |
943 414 |
||||
| Oct14 |
39 13 |
319 174 |
97 28 |
63 23 |
14 11 |
74 16 |
71 29 |
122 13 |
157 94 |
29 17 |
985 418 |
||||
| Nov14 |
43 12 |
245 128 |
66 27 |
60 27 |
16 11 |
62 14 |
56 29 |
119 11 |
135 74 |
30 13 |
832 346 |
||||
| Dec14 |
55 15 |
255 136 |
88 39 |
62 33 |
52 29 |
82 19 |
41 21 |
123 13 |
159 70 |
33 20 |
950 395 |
||||
| 2014 [1] |
330 [16] |
1473 |
462 |
483 [16] |
190 [16] |
150 |
340 |
105 |
1084 [16] |
256 [16] |
4873 |
||||
| Jan15 |
774 308 |
||||||||||||||
| Feb15 |
767 329 |
||||||||||||||
| Mar15 |
982 469 |
||||||||||||||
| Apr15 |
C |
L |
O |
S |
E |
D |
|||||||||
| 2015 |
|||||||||||||||
| Speed Limit [11] Left Yellow [11] [16] Straight Yellow |
45 3.5 4.0 [16] 5.0 |
45 3.5 5.0 |
50 3.5 |
50 4.0 [16] |
50 3.5 4.0 [16] |
45 3.5 |
50 4.5 [11] 5.0 |
45 4.5 [11] 5.0 |
40 3.5 4.0? [16] 5.0 |
50 3.5 4.0? [16] 5.0 |
|||||
| Cam # |
BCNR -01 |
BCSC -01 |
MMMB -01 |
NRBC -01 |
NRMB -01 |
OVLY -01 |
VAMB -01 |
VAMB -03 |
WCSC -01 |
WCSC -03 |
|
|
|
||
| [12] |
Nbd Bou- quet & New- hall |
Ebd Bou- quet & Seco |
Ebd Magic Mtn. & Mc- Bean |
Ebd New- hall & Bou- quet |
Wbd New- hall & Mc- Bean |
Sbd Or- chard Vill. & Lyons |
Ebd Val- encia & Mc- Bean |
Wbd Val- encia & Mc- Bean |
Sbd Whites & Sol- edad |
Nbd Whites & Sol- edad |
|
Straight v. Right v. Left [15] |
Total Violations Recorded/ Notices Printed/ Left Turns [1] [4] [10] |
2004 - 2007 Reports
2008 Reports
2009 Reports
2010 Reports
2010 - 2011 Reports
2011 - 2012 Reports
Fall 2012 Reports
More 2011 - 2012 Reports
Winter 2012 Reports
2012 - 2013 Reports
May 2013 Report
Late 2013 Reports
2005 - 2014 Reports
Mid-2014 Reports
Late 2014 Reports
Early 2015 Reports
[ ] indicates a footnote.
[1] Monthly totals are as provided by the City. Annual totals, or projections, are by highwayrobbery.net.
[2] YTD = Year-to-date total.
[3] Un-used columns are to allow for later expansion of City's system.
[4] Any figures in red type (or, if you are looking at this table in black and white, the upper figure when there are two or more figures in a cell) are what RedFlex calls Total Violations Recorded, or all incidents recorded by the cameras, and due to time limitations may have been posted here only for selected months or locations. If there is sufficient public interest, the remaining months will be posted. The figures in black type are what RedFlex calls Notices Printed, and may represent the sum of genuine citations issued (those filed with the court) plus any Nominations mailed (not filed with the court, a.k.a. Snitch Tickets).
[5] Data was requested on:
[6] The camera enforcement is believed to be on traffic on the first-named street, but the direction of enforcement (north, south, east, west, thru, left, right) is not yet available.
[7] Includes enforcement of posted "no turn on red" signs.
[8] These figures are for the 30-day warning ticket period, July 8 to Aug. 6, 2004.
[9] These figures cover Aug. 7 to Sept. 15, 2004.
[10] Total Violations Recorded for the first quarter (Jan. 1 - Mar. 31) of 2010, calculated using Set # 5, below. The figures in blue type (or, if you are looking at this table in black and white, the figures below the notation for footnote ten) are Total Violations Recorded for left turns only, and also were calculated using Set # 5, below. The data for Notices Printed (citatitions issued) is presented month-by-month.
[11] Speed limits and length of yellow light, from City publication received Apr. 5, 2010. Per the staff report submitted for Mar. 25, 2014 council meeting, and an interview with staff, the citywide signal cycle length was increased from 120 seconds to 132 seconds on June 28, 2013 and the yellows for the left turns from Valencia to McBean were increased by one second, on Feb. 19, 2014. Also see Set # 3 and Set # 4, below.
[12] The title bar has been repeated solely for the convenience of the reader - there is no difference between it and the one at the top of the table.
[13] The report for this month was generated just a few days after the end of the month, so it is likely that not all tickets (for violations which occurred during the month) had been approved and counted by that time.
[14] Due to time limitations, intersection-by-intersection data for this month has not been posted in the table. The data is available
at one of the links just below the table.
[15] The break out by movement - straight, left, right - is from the annual report required by SB 1300 of 2012.
[16] Per a Jan. 14, 2015 SCVNews.com article, the City lengthened the yellows for left turns at some intersections by 1/2 second, sometime during 2014, probably late in the year. Also see Set # 3 and Set # 4, below.
Jan. 2015, Looking at the Trend: Ticketing Down! And Up!
Bouquet/Newhall Cameras
Northbound ticketing was down after the July 2014 yellow increase and somewhat below the lowest year, 2011.
Eastbound ticketing was down after July 2014 but still above 2011 and 2012.
Bouquet/Seco
In 2014 ticketing hit an all time high, several times 2008 - 2011 levels, despite the yellow increase claimed in the Jan. 2015 SCVNews article.
Magic Mountain.McBean
In 2014 ticketing was down slightly from 2013 but well above 2009 - 2011 levels.
Newhall/McBean
Ticketing dropped to an all time low beginning (approx.) in early Feb. 2014.
Orchard/Lyons
Ticketing dropped to an all time low beginning (approx.) in mid-November 2013.
Valencia/McBean Cameras
In 2014 ticketing was at an all time low after the Summer 2013 and Feb. 2014 signal adjustments - see footnote [11] above.
Whites/Soledad Cameras
In 2014 ticketing remained near all time highs, approx. double 2008 - 2011 levels, despite the yellow increase claimed in the Jan. 2015 SCVNews article.
City of Santa Clarita Docs Set # 2
Interview
Here is an interview of the sheriffs who operate the cameras in Santa Clarita.
City of Santa Clarita Docs Set # 3
The Contract, and Contract Termination March 2015
The new
five-year Redflex contract renewal the city signed in
early 2009 set the monthly fee per existing
camera at $4000.
Had
Or, had the council negotiated a $2500 fee like that in the 2009 contract of the City of Davis, it could have saved $900,000.
Or, had the council negotiated a
$2225 fee like that in the 2009
contract of the City of Solana Beach, it could
have saved $1,065,000.
Santa Clarita's 2009 renewal
contained the following clause:
"Financial Feasibility"
"Based on general accepted accounting principles
should the Customer and Redflex determine that the
program is not financially feasible to maintain under
the current pricing per this agreement then the Customer
and Redflex shall enter into negotiations to adjust the
pricing."
(From Exhibit "D" to the 2009 contract.)
The Documents:
Original
Contract,
2003
Staff
Report
for 2009 Renewal
2009
Renewal
Evaluations
Invoices
received in 2013 show that the City was
continuing to pay $4000 per camera.
March 2014: Program Continued, for a Year
At their Mar. 25, 2014 meeting the
city council decided to change the contract term to
month-to-month, for up to a year, to give staff time
to prepare and present an in-depth report. They
did not get a lower price.
Staff
Report
2014
Contract Amendment
March 31,
2015 Will Be Last Day of Operation
The contract was about to
expire so a vote to either extend it, or cancel
it, was scheduled for the Mar. 24, 2015 city
council meeting.
Before the meeting, SCVNews published a guest
editorial
by a local resident, and SaferStreetsLA
submitted a detailed
report.
Staff presented a report
at the meeting and the council voted 3 -2 to let
the contract expire and end the program
(Nays: Weste and McLean).
Article
about the council meeting and the vote.
Another
Article
In late April 2015 a report
about yellow light lengths was published by the
City's consulting engineers. For
more details see Set # 4, below, and footnotes
[11] and [16] in Set # 1, above.
On July 7 the Santa
Clarita Signal said
that the last of the equipment was about to be
removed.
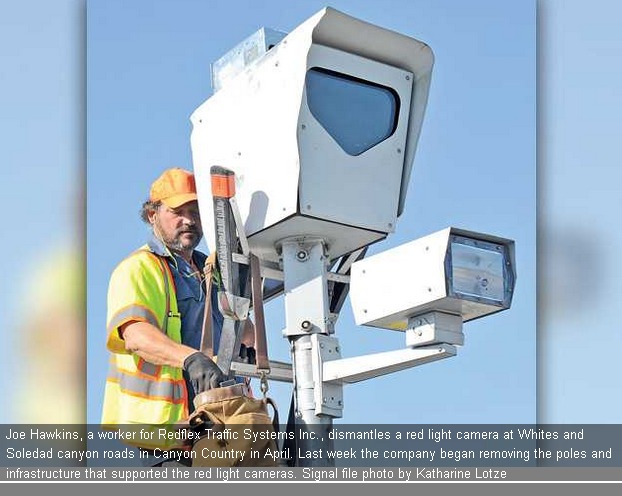
From 7-7-15 Signal article
This listing of contracts and amendments was up-to-date
as of Sept. 15, 2014.
City of Santa Clarita Docs Set # 4
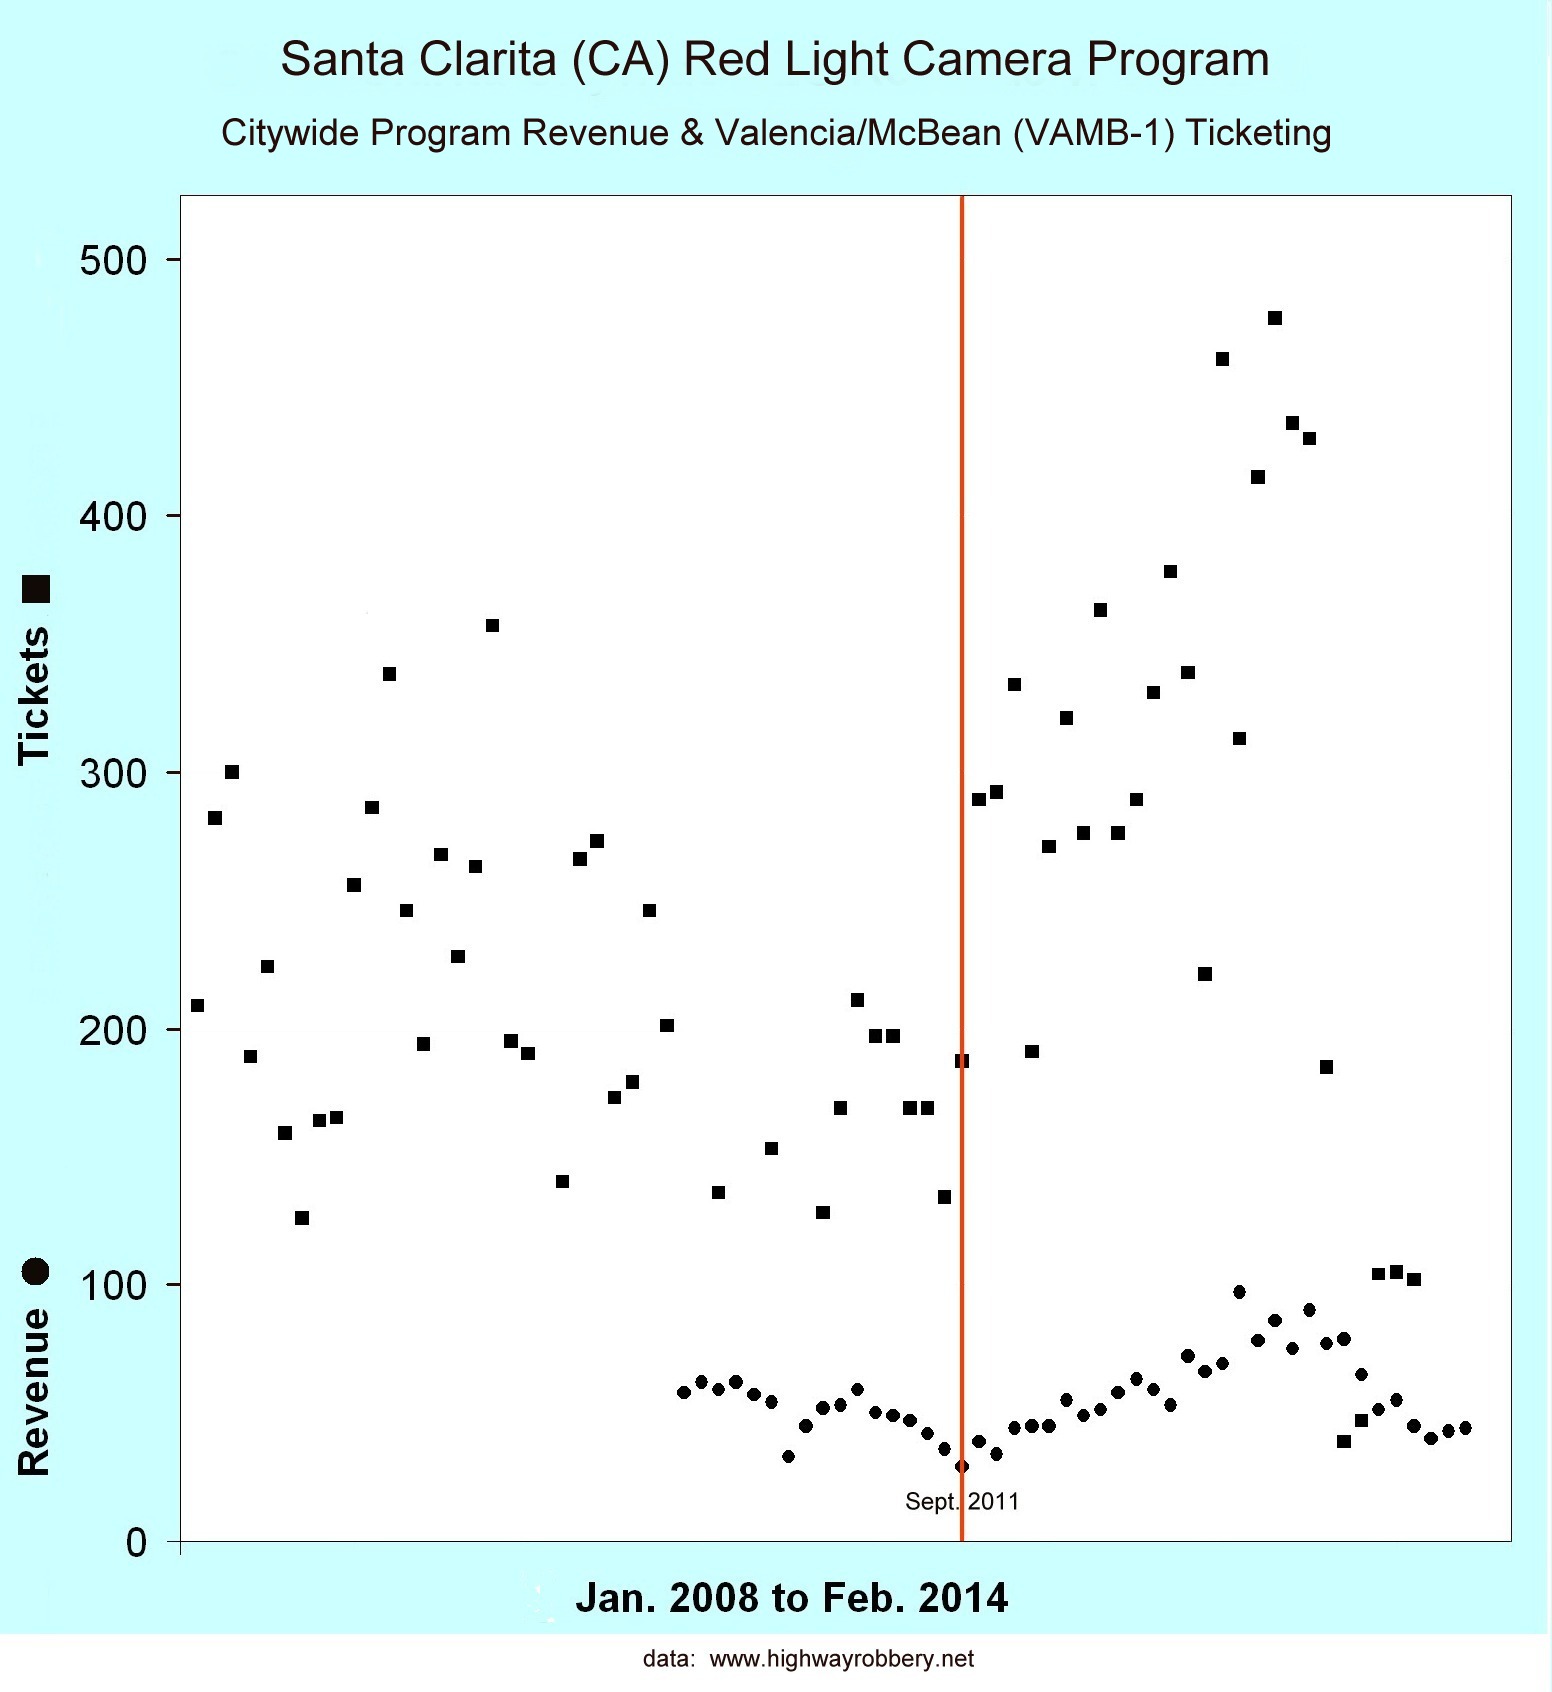
The Revenue
You can track the City's monthly ticket revenue, in the Revenue Spreadsheet on the LA County Docs page.
The chart below shows that shortly after revenue went down in Summer 2011, ticketing went way up. Summer 2011 was when it became public knowledge that in LA County, red light camera tickets can be ignored.
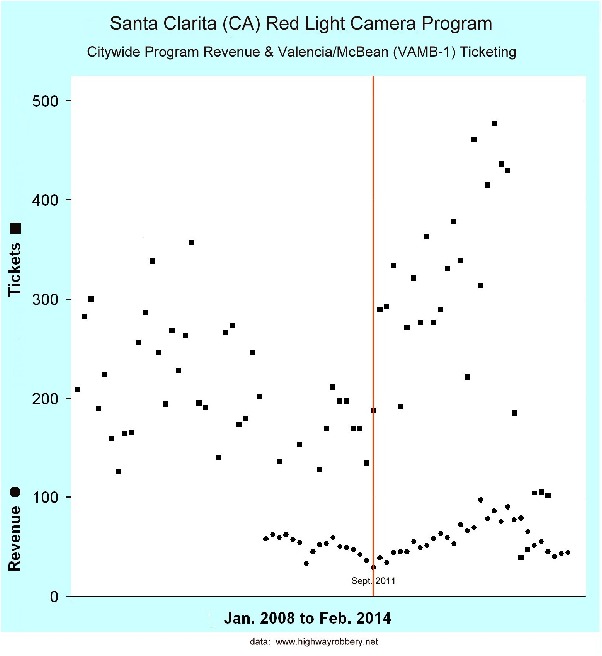
Click here for a larger/clearer copy of this chart.
Late note: By early 2014 the City's setting of a longer signal cycle and a longer yellow brought a 90% or more drop in ticketing at VAMB-1. For more details see Set # 3 and footnotes [11] and [16] in Set # 1, both above.
City of Santa Clarita Docs Set # 5
"Late Time" Graphs
The City provided bar graphs of Late Times, etcetera, for ten cameras.
These bar graphs track Total Violations Recorded, not tickets issued.
All of these intersections have at least two left turn lanes, which in these bar graph reports are designated as Lane 1 and Lane 2.
The data from the 2010 bar graphs shows that 96% of all violations were for left turns, and that 74% of all violations would not have occurred if the yellow times had been 1 second longer or if there had been a 1 second grace period in effect. Flipping the numbers over, we would expect that if Santa Clarita removed that hypothetical extra second, there would be a four-fold increase in violations.
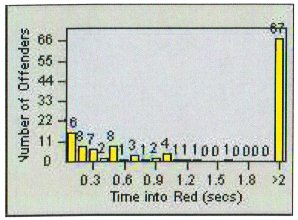
The picture above is an example from another city.
BCNR-01 July 08
BCNR-01 July 09
BCNR-01 1st Qtr. 2010
BCSC-01 July 08
BCSC-01 July 09
BCSC-01 1st Qtr. 2010
MMMB-01 July 08
MMMB-01 July 09
MMMB-01 1st Qtr. 2010
NRBC-01 July 08
NRBC-01 July 09
NRBC-01 1st Qtr. 2010
NRMB-01 July 08
NRMB-01 July 09
NRMB-01 1st Qtr. 2010
OVLY-01 July 08
OVLY-01 July 09
OVLY-01 1st Qtr. 2010
VAMB-01 July 08
VAMB-01 July 09
VAMB-01 1st Qtr. 2010
VAMB-03 July 08
VAMB-03 July 09 (not received)
VAMB-03 1st Qtr. 2010
WCSC-01 July 08
WCSC-01 July 09
WCSC-01 1st Qtr. 2010
WCSC-03 July 08
WCSC-03 July 09
WCSC-03 1st Qtr. 2010
2011:
First Quarter
Second Quarter
Third Quarter
Fourth Quarter 2011, Two Quarters 2012 (8 MB)
Third Quarter 2013
Bar graphs are available for more than fifty other cities - see the list in the expanded version of Defect # 9.
City of Santa Clarita Docs Set # 6
More Coming?
There may be some more Santa Clarita info posted here soon. Please mark your calendar to come back here and have a look!
---------------------------------
RED LIGHT CAMERAS
www.highwayrobbery.net
www.highwayrobbery.net