If
you haven't already done so, please read the
Walnut section on the Camera Towns page
City of
Walnut Documents (Program Closed)
It may be possible to completely
ignore a Walnut ticket.
1. If your "ticket" does not have the Superior
Court's name and address on it, it is a fake ticket,
which I call a "Snitch Ticket." For more details
about Snitch Tickets, see the Snitch Ticket section at
the top of the Your Ticket page.
2. The LA County Superior Court does not report
ignored red light camera tickets to the DMV. More
info is in "Countywide Information," which is Docs Set #
2 on the LA County
Documents page.
Zev "termed out," and in the Nov. 4, 2014 election, Sheila Kuehl won the race to succeed him, by a narrow margin.

Sheila Kuehl, in 2007
During her career in the California
Legislature, Kuehl made three attempts to pass bills to allow
the use of automated speed enforcement (photo radar) in
California.
Kuehl will be up for re-election in Nov. 2018 and Nov. 2022.
Walnut
Docs Set # 1
Ticket
Counts
Total
Violations, Notices Printed [4]
These cameras
are located next to Mt. San Antonio College
(Mt. SAC)
| Cam # |
AMGR-01 |
GRAM-01 |
|
|
|
|||||
| Amar/Temple Ebd @ Grand |
Grand Sbd @ Amar/Temple (may include enforcement of no right turn on red) |
Monthly Average of Notices Printed AMGR [5] |
Monthly Average of Notices Printed GRAM [5] |
Monthly Average of Notices Printed Citywide [5] |
[3] |
Total Citations Issued as % of Events Re- corded |
Total Violations Recorded/ Notices Printed [1] [4] |
|||
| Dec06 |
0 |
0 |
||||||||
| 2006 |
||||||||||
| Jan07 |
728 510 |
138 59 |
866 569 |
|||||||
| Feb07 |
856 546 |
189 77 |
1045 623 |
|||||||
| Mar07 |
921 528 |
145 56 |
1066 584 |
|||||||
| Apr07 |
650 289 |
169 36 |
819 325 |
|||||||
| May07 |
567 182 |
144 29 |
711 211 |
|||||||
| Jun07 |
516 176 |
249 43 |
765 219 |
|||||||
| Jul07 |
733 333 |
300 63 |
1033 396 |
|||||||
| Aug07 |
594 261 |
261 99 |
855 360 |
|||||||
| Sep07 |
713 336 |
279 109 |
992 445 |
|||||||
| Oct07 |
563 256 |
235 108 |
798 364 |
|||||||
| Nov07 |
413 196 |
243 79 |
656 275 |
|||||||
| Dec07 |
379 137 |
183 41 |
562 178 |
|||||||
| 2007 |
||||||||||
| Jan08 |
305 135 |
190 66 |
113 |
61 |
174 | 495 201 |
||||
| Feb08 |
236 112 |
182 81 |
113 |
61 |
174 | 418 193 |
||||
| Mar08 |
261 112 |
174 72 |
113 |
61 |
174 | 435 184 |
||||
| Apr08 |
147 34 |
198 52 |
113 |
61 |
174 | 345 86 |
||||
| May08 |
374 141 |
157 54 |
113 |
61 |
174 | 531 195 |
||||
| Jun08 |
337 112 |
165 49 |
113 |
61 |
174 | 502 161 |
||||
| Jul08 |
341 81 |
253 57 |
113 |
61 |
174 | 594 138 |
||||
| Aug08 |
425 175 |
250 75 |
113 |
61 |
174 | 675 250 |
||||
| Sep08 |
344 167 |
170 62 |
113 |
61 |
174 | 514 229 |
||||
| Oct08 |
108 63 |
88 41 |
113 |
61 |
174 | 196 104 |
||||
| Nov08 |
0 |
0 |
0 |
|||||||
| Dec08 |
0 |
0 |
0 |
|||||||
| 2008 |
||||||||||
| Jan09 |
0 |
0 |
0 |
|||||||
| Feb09 |
0 |
0 |
0 |
|||||||
| Mar09 |
0 |
0 |
0 |
|||||||
| Apr09 |
0 |
0 |
0 |
|||||||
| May09 |
0 |
15 0 |
15 0 |
|||||||
| Jun09 [6] |
444 150 |
268 91 |
130 |
134 |
263 | 712 242 |
||||
| Jul09 [6] |
498 155 |
478 172 |
130 | 134 |
263 | 976 327 |
||||
| Aug09 [5] |
130 | 134 |
263 | |||||||
| Sep09 [5] |
130 | 134 |
263 | |||||||
| Oct09 [6] |
396 132 |
405 193 |
130 | 134 |
263 | 801 325 |
||||
| Nov09 [5] |
130 | 134 |
263 | |||||||
| Dec09 [5] |
130 | 134 |
263 | |||||||
| 2009 [2] |
1964 (proj.) |
|||||||||
| Jan10 [6] |
346 159 |
217 156 |
130 | 134 |
263 | 564 315 |
||||
| Feb10 [5] |
130 | 134 |
263 | |||||||
| Mar10 [5] |
130 | 134 |
263 | |||||||
| Apr10 [6] |
253 132 |
241 135 |
130 | 134 |
263 | 494 267 |
||||
| May10 [5] |
130 | 134 |
263 | |||||||
| Jun10 [5] |
130 | 134 |
263 | |||||||
| Jul10 [6] |
350 110 |
293 90 |
130 | 134 |
263 | 643 200 |
||||
| Aug10 [5] |
130 | 134 |
263 | |||||||
| Sep10 [5] |
130 | 134 |
263 | |||||||
| Oct10 [6] |
233 143 |
202 129 |
130 | 134 |
263 | 435 272 |
||||
| Nov10 [5] |
130 | 134 |
263 | |||||||
| Dec10 [5] |
130 | 134 |
263 | |||||||
| 2010 [2] |
3159 (proj.) |
|||||||||
| Jan11 |
222 138 |
250 148 |
130 | 134 |
263 | 472 286 |
||||
| Feb11 [5] |
130 | 134 |
263 | |||||||
| Mar11 [5] |
130 | 134 |
263 | |||||||
| Apr11 |
174 94 |
221 95 |
130 | 134 |
263 | 395 189 |
||||
| May11 [5] |
130 | 134 |
263 | |||||||
| Jun11 |
223 94 |
268 138 |
130 | 134 |
263 | 461 232 |
||||
| Jul11 [5] |
[8] | 124 |
43 |
166 |
||||||
| Aug11 [5] |
[8] | 124 |
43 |
166 |
||||||
| Sep11 [5] |
[8] | 124 |
43 |
166 |
||||||
| Oct11 [5] |
[8] | 124 |
43 |
166 |
||||||
| Nov11 [5] |
[8] | 124 |
43 |
166 |
||||||
| Dec11 [5] |
[8] | 124 |
43 |
166 |
||||||
| 2011 [2] |
2701 (proj.) |
|||||||||
| Jul11- Dec11 (6 mos.) [5] |
1899 741 |
564 257 |
2463 998 [5] |
|||||||
| Jun09- Jan12 (32 mos.) [5] |
9855 4109 |
7353 3738 |
|
17208 7847 [5] |
||||||
| Jan12 [6] [5] |
341 162 |
43 24 |
130 |
134 |
263 | 384 186 |
||||
| Feb12 [6] |
252 133 |
30 16 |
282 149 |
|||||||
| Mar12 |
451 196 |
45 36 |
496 232 |
|||||||
| Apr12 |
418 175 |
39 28 |
457 203 |
|||||||
| May12 |
670 261 |
43 37 |
713 298 |
|||||||
| Jun12 |
324 114 |
39 27 |
363 141 |
|||||||
| Jul12 |
228 90 |
26 15 |
254 105 |
|||||||
| Aug12 |
379 192 |
32 23 |
411 215 |
|||||||
| Sep12 |
537 256 |
204 154 |
741 410 |
|||||||
| Oct12 |
512 235 |
553 430 |
1065 663 |
|||||||
| Nov12 |
383 150 |
220 138 |
603 288 |
|||||||
| Dec12 |
465 153 |
565 265 |
1030 418 |
|||||||
| 2012 [2] |
3308 |
|||||||||
| Jan13 |
364 153 |
476 296 |
840 449 |
|||||||
| Feb13 |
461 176 |
404 230 |
865 406 |
|||||||
| Mar13 |
541 219 |
506 333 |
1047 552 |
|||||||
| Apr13 |
493 221 |
413 277 |
906 498 |
|||||||
| May13 |
567 201 |
434 312 |
1001 513 |
|||||||
| Jun13 |
553 212 |
411 284 |
964 496 |
|||||||
| Jul13 |
508 192 |
457 330 |
965 522 |
|||||||
| Aug13 |
598 197 |
464 329 |
1062 526 |
|||||||
| Sep13 |
631 125 |
482 246 |
1113 371 |
|||||||
| Oct13 |
408 110 |
432 299 |
840 409 |
|||||||
| Nov13 |
360 73 |
455 238 |
815 311 |
|||||||
| Dec13 |
731 265 |
|||||||||
| 2013 [2] |
5318 |
|||||||||
| Jan14 |
658 286 |
|||||||||
| Feb14 |
665 312 |
|||||||||
| Mar14 |
924 337 |
|||||||||
| Apr14 |
923 301 |
|||||||||
| May14 |
CLOSED |
CLOSED |
||||||||
| Jun14 |
See |
See |
||||||||
| Jul14 |
Set # 3, |
Set # 3, |
||||||||
| Aug14 |
below. |
below. |
||||||||
| 2014 [2] |
1545 (proj.) |
|||||||||
| Cam # |
AMGR-01 |
GRAM-01 |
AMGR |
GRAM |
Citywide |
|
|
|
||
| Amar/Temple Ebd @ Grand |
Grand Sbd @ Amar/Temple (may include enforcement of no right turn on red) |
Monthly Average of Notices Printed [5] |
Monthly Average of Notices Printed [5] |
Monthly Average of Notices Printed Citywide [5] |
[3] |
Total Citations Issued as % of Events Re- corded |
Total Violations Recorded/ Notices Printed [1] [4] |
This table made by highwayrobbery.net, using official reports provided by the City under the California Public Records Act.
Official reports, 2006 - 2009
Official reports, 2009 - 2010, recd Jan. 2013
Official report, Jun. 2009 - Jan. 2012 (32 months)
Official reports, 2011
Official reports, Jan12 - Mar12
Official report, Apr12
Official reports, May12 - Dec12
Official report, Jan13
Official reports, Feb13 - Jul13
Official report, Aug13
Official report, Sep13
Official reports, Oct13 - Nov13
Official reports, Dec13 - Mar14
Official report, Apr14
[ ] indicates a footnote.
[1] Totals are as provided by the City.
[2] Annual total, or annual projection, is by highwayrobbery.net. The projections for 2009, 2010 and 2011 are the average of the monthly averages highwayrobbery.net derived from the grand total reports the City provided (see footnote 5, below) and the months for which individual reports were obtained from the City.
[3] Un-used columns are to allow for later expansion of City's system.
[4] Any figures in red type (or, if you are looking at this table in black and white, the upper figure when there are two or more figures in a cell) are what RedFlex calls Total Violations, or all incidents recorded by the cameras, and due to time limitations may have been posted here only for selected months or locations. If there is sufficient public interest, the remaining months will be posted. The figures in black type are what RedFlex calls Notices Printed, and represent the sum of genuine citations issued (those filed with the court) plus any Nominations mailed (not filed with the court, a.k.a. Snitch Tickets).
[5] Calendar month data was requested on 1-30-12 but the City provided only a six-month grand total and a 32-month grand total. In the table above, highwayrobbery.net averaged those grand totals over the six months and over the 26 months the two report periods did not overlap. For comparison, highwayrobbery.net also averaged the Notices Printed in the ten months of 2008 for which information has been made available. The 263 average for the 2009 - 2012 period represents a 51% increase over the 174 average for 2008.
[6] The official reports for these months were run for the first of the month to the first of the next month. To keep the figures displayed comparable to the figures for other months, 3% has been deducted.
[7] Includes enforcement of posted "no turn on red."
[8] Month-by-month data was requested on 2-28-13, 4-4-13, 5-23-13, 6-30-13 and 8-15-13.
Walnut Docs Set # 2
"Late Time"
Graphs
The City provided bar graphs of
Late Times, etcetera, for both cameras.
These graphs
track violations recorded, not tickets issued.
Where
there is a large number of long Late Time violations in
a curb lane, it is believed to indicate heavy ticketing
on right turns.
(The curb lane will be the lane with the highest lane
number.)
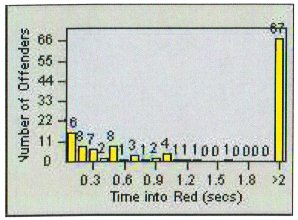
The picture above is an example from another
city.
Bar
Graphs 2008 - 2009
Bar
Graphs Oct. 2011
Walnut Docs Set # 3
Contracts - Program Closed in May 2014
The city council heard a staff
report in late 2005.
The council approved Walnut's first
contract with RedFlex in Aug. 2006.
Like the cities of Baldwin Park, Capitola, Citrus Heights, Highland, South San Francisco and Victorville, Walnut failed to hold the formal public hearing required by CVC 21455.6 before it approved the 2006 contract; neither of the 2005 - 2006 council items was set as a public hearing. See the expanded version of Defect # 6.
In Jan. 2009 the council approved a new
speed
survey.
In Feb. 2009 - two years before the expiration of the
first contract - the council approved a new
five-year contract.
The new contract provided for a slightly lower rent for
the cameras - $5750 per camera per month vs. the former
$6000.
Both contracts included, in Exhibit D,
an illegal "cost neutrality" clause, whereby the city
will not have to pay RedFlex the full rent if there
aren't enough fines to cover the cost. See
Subsection B of Defect # 10.
Section 11.14 of the 2009 contract
penalizes the City if:
"...the City or Police waives more than 10 percent
of valid violations forwarded to the Police for
acceptance...."
(See Subsection A of Defect # 9, about quotas.)
Section 11.14 also penalizes the City
if:
"...the City elects not to enforce illegal right
turn on red violations...."
The slight rent reduction in the 2009
contract will save the City $30,000 over the 60 month
term of the contract.
Despite the lower price the City still will pay
$330,000 too much over the five years (when compared
with a $3000 target price). See FAQ #
17.
In Aug. 2011 the council reviewed
the program, including accident statistics.
In July 2013 the council approved a
new speed
survey.
2014: Two-Year Extension Proposed
The 2009 contract was due to expire in
Feb. 2014, so City staff and the sheriff prepared a
report, for presentation at the Jan. 8, 2014 council
meeting. The report discussed the option to
extend the program another two years.
Staff Report,
Including Sheriff's Crash Stats
In the staff report there was no
indication of bargaining to obtain a lower rent during
the potential two-year extension, despite the fact that
cities near Walnut pay about half what Walnut has been
paying. If the rent is left at $5750, Walnut will
pay $132,000 too much over the two years. See FAQ
# 17.
On Dec. 29 the San Gabriel Valley
Tribune published an article
about the upcoming decision.
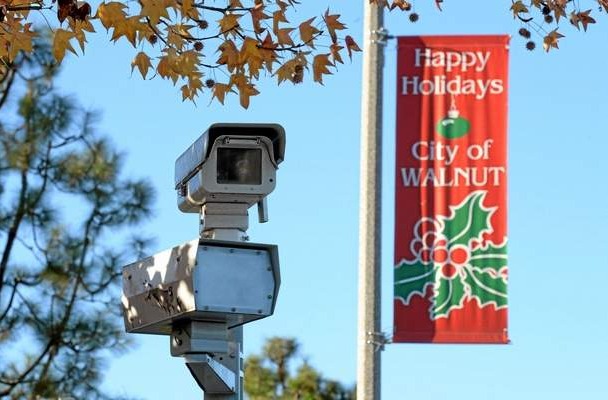
Photo by Keith Birmingham, SGV Tribune
On Jan. 7 I attended a trial session. (Anyone who wishes to watch the court trials of Walnuts tickets can come to the El Monte courthouse on Valley Blvd. one block north of the 10 freeway, at 1:30 on the first, second and fourth Tuesdays of the month. The trials are public.) At the Jan. 7 trial session there were 49 Walnut camera tickets on the calendar. Of those, 27 defendants had their fine cut in half, with no point, 11 defendants had their tickets dismissed, one pled no contest, one was found guilty, and nine didn't show up at court so forfeited their bail.
On Jan. 7 SaferStreetsLA published
their analysis
of the program.
On Jan. 7 the Walnut-Diamond Bar Patch
published an article
about the program.
At the Jan. 8 council meeting, the
council voted to extend the contract for three months
(to May 2014), to allow time for further study of the
program, including more input from the public.
Post-meeting articles: Tribune
Patch
Program Closed!
At the May 14, 2014 council meeting the
council voted 5 - 0 on a staff
recommendation to let the contract expire, ending
the program in late May.
In a SGV Tribune article published 5-19-14 Mayor Tony Cartagena was quoted as saying:
"The statistical review of the RedFlex
camera program did not reflect a reduction of traffic
accidents, nor could the data support the cameras made
the intersections safer."
This list of contracts and amendments was up-to-date
as of 5-20-14.
Walnut Docs Set # 4
"No Right Turn
on Red" Tickets
The use of cameras to enforce No Right Turn on Red signs
is relatively rare, but it appears that in Sep. 2012
Walnut began heavy enforcement on right turns from
southbound Grand to westbound Amar.
There is some question about which section of the
Vehicle Code should be used - and it has a big effect
upon the price of the ticket. See the discussion
in the big blue box on the AB 909
page.
If you received a ticket for that right
turn, please contact me.
Walnut Docs Set # 5
The Revenue
The City's monthly ticket revenue from the court is
available in the Revenue Spreadsheet on the LA County
Docs page.
Walnut Docs Set # 6
More Coming
There may be some more Walnut information posted in the
next few weeks. Mark your calendar to remind you
to come back here and look!
---------------------------------
RED LIGHT CAMERAS
www.highwayrobbery.net
www.highwayrobbery.net