Email
Address
Site
Index
by Subject
If
you haven't already done so, please read the
Lynwood section on the Camera Towns page
City of Lynwood Documents - Closed
Sept. 2017
(and Information)
Lynwood, pop. 66,000, is 5 miles south of
downtown Los Angeles.
It may be possible to completely ignore a Lynwood
ticket.
1. The LA County Superior Court does not
report ignored red light camera tickets to the
DMV. More info is in "Countywide Information,"
which is Docs Set # 2 on the LA County
Documents page.
2. If your "ticket" does not have the
Superior Court's name and address on it, it is a fake
ticket, which I call a "Snitch Ticket." For more
details about Snitch Tickets, see the Snitch Ticket
section at the top of the Your Ticket page.
2015
- 2017: Is a Refund Needed? See Set # 5,
below.
Aug.
15, 2017: Program Ended - see Set # 4, below.
Vote No on Sheila Kuehl
Do you live in LA County? Was
Zev Yaroslavsky your County Supervisor? (Until
Nov. 2014, he represented the Third District, which
includes the central and western San Fernando Valley,
Malibu, Santa Monica, Venice, Beverly Hills, the City
of West Hollywood, and part of Hollywood.)

Sheila "Kuehl Cams" Kuehl, in 2007
During her career in the California
Legislature, Kuehl made three attempts to pass bills to
allow the use of automated speed enforcement (photo
radar) in California.
In 2016 she voted to put an additional LA County-wide sales tax, to go to Metro, on the Nov. 2016 ballot - and it passed. (See Measure M on the Action/Legis page, for more about that tax.)
Kuehl will be up for re-election in
Nov. 2022.
Lynwood Docs Set # 1
Ticket
Counts
2008 - 2009 Counts
In April
2009 the City sent me some tables showing
the money it received from the court, and
the disposition of the tickets.
2004 - 2017
Counts
Total
Violations Recorded, Notices Printed, Citations
Issued [4]
New
11-30-05, updated 9-25-18
| Cam # |
IMAT-01 |
IMLB-01 |
|
|
||||
| Imperial WB @ Atlantic |
Imperial WB @ Long Beach |
The City's Revenue from Fines (Thousands) [8] |
Total Notices Printed as % of Violations Recorded |
Total Violations Recorded/ Notices Printed/ Citations Issued per Invoices [1] [4] |
||||
| Nov04 |
136 67 |
|||||||
| Dec04 |
137 79 39 |
|||||||
| 2004 |
||||||||
| Jan05 |
126 63 45 |
|||||||
| Feb05 |
107 60 47 |
|||||||
| Mar05 |
136 76 68 |
|||||||
| Apr05 |
110 58 39 |
|||||||
| May05 |
42 |
|||||||
| Jun05 |
16 |
|||||||
| Jul05 |
98 52 35 |
|||||||
| Aug05 |
40 |
|||||||
| Sep05 |
||||||||
| Oct05 |
||||||||
| Nov05 |
||||||||
| Dec05 |
||||||||
| 2005 |
||||||||
| Jan06 |
43 % |
256 111 |
||||||
| Feb06 |
||||||||
| Mar06 |
47% |
289 137 |
||||||
| Apr06 |
35 % |
292 102 |
||||||
| May06 |
||||||||
| Jun06 |
||||||||
| Jul06 |
23 % |
379 87 |
||||||
| Aug06 |
||||||||
| Sep06 |
27% |
350 95 |
||||||
| Oct06 |
24 % |
403 96 |
||||||
| Nov06 |
||||||||
| Dec06 |
||||||||
| 2006 |
32 % |
3938 1256 (Proj.) |
||||||
| Jan07 |
50 % |
344 171 |
||||||
| Feb07 |
||||||||
| Mar07 |
378 144 |
0 0 |
378 144 |
|||||
| Apr07 |
27 % |
290 79 |
||||||
| May07 |
||||||||
| Jun07 |
37 % |
396 148 |
||||||
| Jul07 |
||||||||
| Aug07 |
||||||||
| Sep07 |
23% |
480 108 |
||||||
| Oct07 |
33 % |
356 118 |
||||||
| Nov07 |
||||||||
| Dec07 |
||||||||
| 2007 |
33 % |
1536 (Proj.) |
||||||
| Jan08 |
50 % |
328 163 |
||||||
| Feb08 |
||||||||
| Mar08 |
514 96 |
0 0 |
514 96 |
|||||
| Apr08 |
20 % |
361 73 |
||||||
| May08 |
||||||||
| Jun08 |
||||||||
| Jul08 |
27 % |
450 122 |
||||||
| Aug08 |
||||||||
| Sep08 |
251 73 |
207 95 |
458 168 |
|||||
| Oct08 |
43 % |
442 189 |
||||||
| Nov08 |
||||||||
| Dec08 |
||||||||
| 2008 |
35 % |
1622 (Proj.) |
||||||
| Jan09 |
226 46 |
161 43 |
23 % |
387 89 |
||||
| Feb09 |
301 79 |
119 41 |
29 % |
420 120 |
||||
| Mar09 |
349 83 |
178 45 |
24 % |
527 128 |
||||
| Apr09 |
393 52 |
86 4 |
12 % |
479 56 |
||||
| May09 |
372 33 |
126 36 |
14 % |
498 69 |
||||
| Jun09 |
266 44 |
122 33 |
20 % |
388 77 |
||||
| Jul09 |
345 109 |
57 16 |
31 % |
402 125 |
||||
| Aug09 |
385 144 |
21 0 |
35 % |
406 144 |
||||
| Sep09 |
47 % |
392 186 |
||||||
| Oct09 |
312 173 |
123 61 |
54 % |
435 234 |
||||
| Nov09 |
53 % |
362 193 |
||||||
| Dec09 |
56 % |
342 190 |
||||||
| 2009 |
32 % |
5038 1611 |
||||||
| Jan10 |
299 158 |
89 25 |
47 % |
388 183 |
||||
| Feb10 |
55 % |
399 218 |
||||||
| Mar10 |
56 % |
420 234 |
||||||
| Apr10 |
273 115 |
73 26 |
41 % |
346 141 |
||||
| May10 |
292 149 |
123 72 |
13 |
53 % |
415 221 |
|||
| Jun10 |
11 |
46 % |
400 182 |
|||||
| Jul10 |
266 109 |
85 42 |
10 |
43 % |
351 151 |
|||
| Aug10 |
307 140 |
118 52 |
14 |
45 % |
425 192 |
|||
| Sep10 [5] |
287 95 |
139 48 |
10 |
34 % |
426 143 |
|||
| Oct10 |
124 2 |
102 39 |
13 |
18 % |
226 41 |
|||
| Nov10 |
9 |
37 % |
292 107 |
|||||
| Dec10 |
10 |
44 % |
255 113 |
|||||
| 2010 |
90 |
44 % |
4343 1926 |
|||||
| Jan11 |
219 85 |
105 55 |
10 |
43 % |
324 140 |
|||
| Feb11 |
211 78 |
96 55 |
8 |
43 % |
307 133 |
|||
| Mar11 |
597 83 |
109 42 |
15 |
18 % |
706 125 |
|||
| Apr11 |
11 5 |
2 2 |
11 |
54 % |
13 7 |
|||
| May11 |
291 42 |
187 48 |
11 |
19 % |
478 90 |
|||
| Jun11 |
307 39 |
162 25 |
7 |
14 % |
469 64 |
|||
| Jul11 |
294 35 |
117 25 |
7 |
15 % |
411 60 |
|||
| Aug11 |
454 90 |
147 20 |
4 |
18 % |
601 110 |
|||
| Sep11 |
417 190 |
179 102 |
3 |
49 % |
596 292 |
|||
| Oct11 |
466 203 |
207 87 |
4 |
43 % |
673 290 |
|||
| Nov11 |
386 111 |
162 42 |
7 |
28 % |
548 153 |
|||
| Dec11 |
335 155 |
197 68 |
5 |
42 % |
532 223 |
|||
| 2011 [2] |
3988 1116 |
1670 571 |
92 |
30 % |
5658 1687 |
|||
| Jan12 |
336 157 |
160 58 |
7 |
43 % |
496 215 |
|||
| Feb12 |
279 141 |
217 124 |
12 |
53 % |
496 265 |
|||
| Mar12 |
354 153 |
190 107 |
12 |
48 % |
544 260 |
|||
| Apr12 |
406 199 |
212 98 |
8 |
48 % |
618 297 |
|||
| May12 |
335 147 |
189 75 |
10 |
42 % |
524 222 |
|||
| Jun12 |
432 239 |
198 94 |
10 |
53 % |
630 333 |
|||
| Jul12 |
456 246 |
177 97 |
10 |
54 % |
633 343 |
|||
| Aug12 |
439 216 |
180 93 |
11 |
50 % |
619 309 |
|||
| Sep12 |
268 165 |
181 113 |
10 |
62 % |
449 278 |
|||
| Oct12 |
249 140 |
204 133 |
12 |
60 % |
453 273 |
|||
| Nov12 |
196 136 |
222 148 |
11 |
68 % |
418 284 |
|||
| Dec12 |
198 125 |
249 175 |
9 |
67 % |
447 300 |
|||
| 2012 [2] |
3948 2064 |
2379 1315 |
122 |
53 % |
6327 3379 |
|||
| Jan13 |
173 116 |
194 130 |
10 |
67 % |
367 246 |
|||
| Feb13 |
193 124 |
207 136 |
15 |
65 % |
400 260 |
|||
| Mar13 |
198 106 |
163 99 |
15 |
57 % |
361 205 |
|||
| Apr13 |
228 113 |
195 115 |
13 |
54 % |
423 228 |
|||
| May13 |
237 143 |
248 156 |
12 |
62 % |
485 299 |
|||
| Jun13 |
186 111 |
165 103 |
10 |
61 % |
351 214 |
|||
| Jul13 |
148 70 |
193 105 |
12 |
51 % |
341 175 |
|||
| Aug13 |
146 61 |
117 47 |
8 |
41 % |
263 108 |
|||
| Sep13 |
150 75 |
106 41 |
11 |
45 % |
256 116 |
|||
| Oct13 |
193 103 |
183 96 |
10 |
53 % |
376 199 |
|||
| Nov13 |
189 105 |
161 93 |
8 |
57 % |
350 198 |
|||
| Dec13 |
146 60 |
200 86 |
7 |
42 % |
346 146 |
|||
| 2013 [2] |
2187 1187 |
2132 1207 |
131 |
55 % |
4319 2394 |
|||
| Jan14 |
129 79 |
236 152 |
8 |
63 % |
365 231 |
|||
| Feb14 |
169 103 |
192 126 |
17 |
63 % |
361 229 |
|||
| Mar14 |
103 65 |
145 91 |
13 |
63 % |
248 156 |
|||
| Apr14 |
174 92 |
229 122 |
10 |
53% |
403 214 |
|||
| May14 |
246 110 |
243 122 |
11 |
47% |
489 232 |
|||
| Jun14 |
227 103 |
62 22 |
13 |
43% |
289 125 |
|||
| Jul14 |
216 87 |
246 71 |
8 |
34% |
462 158 |
|||
| Aug14 |
230 86 |
250 91 |
8 |
37% |
480 177 |
|||
| Sep14 |
296 96 |
109 18 |
8 |
28% |
405 114 |
|||
| Oct14 |
320 104 |
187 64 |
8 |
33% |
507 168 |
|||
| Nov14 |
259 110 |
112 51 |
7 |
43% |
371 161 |
|||
| Dec14 |
269 79 |
136 41 |
8 |
30% |
405 120 |
|||
| 2014 [2] |
2638 1114 |
2147 971 |
119 |
44% |
4785 2085 |
|||
| Jan15 |
256 70 |
95 57 |
7 |
36% |
351 127 |
|||
| Feb15 |
259 109 |
245 165 |
9 |
54% |
504 274 |
|||
| Mar15 |
297 147 |
227 166 |
12 |
60% |
524 313 |
|||
| Apr15 |
338 156 |
112 80 |
11 |
52% |
450 236 |
|||
| May15 |
318 120 |
174 104 |
12 |
46% |
492 224 |
|||
| Jun15 |
445 215 |
282 177 |
10 |
54% |
727 392 |
|||
| Jul15 |
742 392 |
340 219 |
10 |
56% |
1082 611 |
|||
| Aug15 |
800 354 |
346 215 |
16 |
50% |
1146 569 |
|||
| Sep15 |
901 397 |
312 189 |
16 |
48% |
1213 586 |
|||
| Oct15 |
838 424 |
398 236 |
23 |
53% |
1236 660 |
|||
| Nov15 |
585 311 |
336 208 |
19 |
56% |
921 519 |
|||
| Dec15 |
713 371 |
346 221 |
24 |
56% |
1059 592 |
|||
| 2015 [2] |
6492 3066 |
3213 2037 |
169 |
53% |
9705 5103 |
|||
| Jan16 |
640 310 |
312 190 |
24 |
53% |
952 500 |
|||
| Feb16 |
463 236 |
329 202 |
25 |
55% |
792 438 |
|||
| Mar16 |
731 324 |
437 245 |
25 |
49% |
1168 569 |
|||
| Apr16 |
761 320 |
389 195 |
25 |
45% |
1150 515 |
|||
| May16 |
679 342 |
379 218 |
25 |
53% |
1058 560 |
|||
| Jun16 |
734 362 |
383 215 |
26 |
52% |
1177 577 |
|||
| Jul16 |
866 455 |
418 237 |
26 |
54% |
1284 692 |
|||
| Aug16 |
866 374 |
414 183 |
32 |
44% |
1280 557 |
|||
| Sep16 |
874 253 |
396 135 |
28 |
31% |
1270 388 |
|||
| Oct16 [9] |
25 |
1250 518 |
||||||
| Nov16 [7] |
24 |
|||||||
| Dec16 [7] |
26 |
|||||||
| 2016 [1] [10] |
8876 4030 |
4448 2205 |
311 |
47% |
13324 6235 |
|||
| Jan17 [7] |
21 |
|||||||
| Feb17 [7] |
26 |
|||||||
| Mar17 [11] |
31 |
|||||||
| Apr17 [11] |
25 |
|||||||
| May17 [11] |
26 |
|||||||
| Jun17 [11] |
26 |
|||||||
| Jul17 [11] |
23 |
|||||||
| Aug17 |
20 |
|||||||
| Sep17 |
19 |
|||||||
| Oct17 |
12 |
|||||||
| Nov17 |
12 |
|||||||
| Dec17 |
9 |
|||||||
| 2017 [2] |
250 |
- 3970 |
||||||
| Cam # |
IMAT-01 |
IMLB-01 |
|
|
||||
| Imperial WB @ Atlantic |
Imperial WB @ Long Beach |
The City's Revenue from Fines (Thousands) [8] |
Total Notices Printed as % of Violations Recorded |
Total Violations Recorded/ Notices Printed/ Citations Issued per RedFlex CMR [1] [4] |
2010 - 2012 official documents (to Feb. 2012)
2009 - 2012 official documents (to Mar. 2012)
2010 - 2012 official documents (to Aug. 2012)
2004 - 2013 official documents (to Feb. 2013)
2006 - 2012 official documents (to Sep. 2012)
2006 - 2013 official documents (to May 2013)
2013 - 2014 official documents (to Mar. 2014)
2006 - 2014 official documents (to Aug. 2014)
2007 - 2015 official documents (to Apr. 2015)
2015 - 2016 official documents (to Sep. 2016)
2015 - 2016 official documents (to Oct. 2016)
2016 official documents (12 months) [10]
[ ] indicates a footnote.
[1] Totals are as provided by the City.
[2] These annual totals, or annual projections, are by highwayrobbery.net. The 2017 citations total was estimated based upon the Jan. - Aug. fine revenue.
[3] Un-used columns are to allow for later expansion of City's system.
[4] Any figures in red type (or, if you are looking at this table in black and white, the upper figure when there are two or more figures in a cell) are what RedFlex calls Total Violations, or all incidents recorded by the cameras, and due to time limitations may have been posted only for selected months or locations. If there is sufficient public interest, the remaining months will be posted. The figures in black type are what RedFlex calls Notices Printed, and represent the sum of genuine citations issued (those filed with the court) plus any Nominations mailed (not filed with the court, a.k.a. Snitch Tickets). Figures in blue type (or, if you are looking at this table in black and white, in italic type) are total Cites Issued (filed with the court), per RedFlex's monthly invoices to the City.
[5] Data was received on 9-7-12. Intersection-by-intersection data will be posted to this table as time permits. The official documents are available at the link above.
[6] The camera enforcement is believed to be on traffic on the first-named street, but the direction of enforcement (north, south, east, west, thru, left, right) is not yet available.
[7] Data for these months was requested on 2-28-17. As of 8-11-17 there has been no response.
[9] In the report for this month, there was a quantity of incidents noted as "in progress," so the eventual total Notices Printed will be higher than the figure entered in the table above.
[10] The 2016 annual totals were found in the staff report for the 8-15-17 city council meeting, available at link in Set # 4, below.
[11] Data for these months was requested on on 7-6-17. As of 8-11-17 there has been no response.
An official report showed that in 2014, 83% of the City's tickets were for turns, mostly right turns.
Lynwood Docs Set # 3
"Late Time"
Graphs
The City provided bar graphs of
Late Times, etcetera, for its camera.
These graphs
track violations recorded, not tickets issued.
Where
there is a large number of long Late Time violations in
a curb lane, it is believed to indicate heavy ticketing
on right turns.
(The curb lane will be the lane with the highest lane
number.)
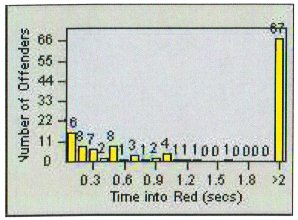
The picture above is an example from another
city.
Lynwood
Bar
Graphs, Imperial/Long Beach Bl. 2008 - 2009
Lynwood
Bar
Graphs, Imperial/Atlantic 2008 - 2009
Lynwood
Bar Graphs, Mar. 2012 (starts at pg. 12 of pdf)
Lynwood
Bar Graphs, July 2014
Lynwood
Bar Graphs, June 2016
Lynwood
Bar Graphs, 2016 Full Year
Lynwood Docs Set # 4
The Contract - Paying Too Much, So Issue More Tickets!
Lynwood held the
required public hearing on Dec. 16, 2003, considered a staff
report, and on Dec. 18 (two weeks before the
effective date of CVC 21455.5(g)), signed a
pay-per-ticket contract
with RedFlex.
Minutes
The contract provided:
"RedFlex will be paid $89 for the first three
Citations issued on a single day from a particular
Designated Intersection. RedFlex will be paid $80
for the fourth and subsequent Citations issued on a
single day from a particular Designated Intersection."
On Dec. 18, 2008 the City Council considered a staff
report and then approved a new
five-year contract including an illegal "cost
neutrality" clause, whereby the city did not have to pay
RedFlex the full rent if there wasn't enough fine
revenue to cover the cost. See Subsection B. of
Defect # 10.
Minutes
The 2008 contract penalized the City should it choose
not to enforce right-hand turn violations.
That contract also said: "Definitions. 'Warning Period' means a period after the Installation Date of the first intersection approach..." (Emphasis added.) See Defect # 6.
The 2008 contract
set the monthly fee per existing camera at $5000.
Had
To see what other cities pay, go to FAQ # 17.
2014: New
Contract
On the council
agenda for Oct. 1, 2013 there was a staff request for
the council to "provide direction" about the possible
extension of the contract.
The minutes indicate that accident statistics were
presented, but the City lost all copies of those
presentations.
Staff
Report
and Minutes, 10-1-13
The council asked for the item to be brought back, at a
later meeting, with a detailed analysis.
On the council
agenda for Mar. 18, 2014 there was a staff
report recommending a five-year extension of the
camera program. During the meeting, the sheriff
told the council that 77% of all tickets have been going
to visitors - and a councilmember proposed that the fine
be reduced for City residents. The council voted
to "table" the matter. Minutes
The staff report
also revealed that after some negotiation, RedFlex had
provided the City a "Cost Neutrality Clause Repayment"
of $28,242.
The staff
report prepared for the June 17, 2014 meeting
recommended a five year extension and the continuation
of Cost Neutrality. The city council voted 3 - 2
(Ayes: Castro, Santillan-Beas and Hernandez) to
extend the contract, but for only three years (ending
June 30, 2017), at a new rent of $3400 per camera per
month. Minutes
In March 2014 the
City of Elk Grove, California approved a new contract
which specified the following rents for their five
RedFlex cameras.
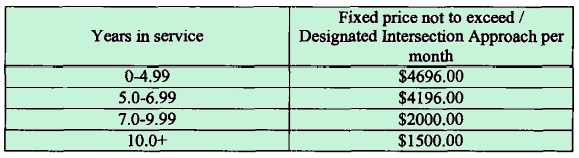
From Exh. D of the Elk
Grove Contract
Because Lynwood
did not negotiate for a similar schedule of rents, the
City will pay 59% too much over the three years,
$100,800 extra based on a target price of $2000.
To cover that extra rent, the City will need to issue an
extra 3054 tickets (in 2014 the City's fine
revenue averaged $33 for each ticket it issued).
Lynwood's new
contract of 2014 does not contain an escape
clause - a way for the city council to end the program
before the three years is up.
2017: New Contract?
At their July 5,
2017 meeting the council reviewed a staff
report recommending a four-year extension of the
program, with no reduction in price, and still no escape
clause. The vote was a 2 - 2 tie (Ayes:
Castro and Santillan-Beas, Nays: Alatorre and
Solache), leaving the item likely to come back at the
next council meeting when Councilmember Hernandez is
to be present. Minutes
Problems with
the proposed new contract:
1. Safety is
the whole reason to operate red light cameras, but there's
no discussion of it in the staff report. Is the 2017
process to be a repeat of what happened in 2013 - 2014,
when the safety presentation was last minute, during the
meeting, with all record of it disappearing
afterward? Now - before a new four-year
contract is signed - the council should be provided with a
report about whether the cameras actually improve
safety. That report should also include details of
the engineering changes staff may have made to improve
safety - for example, has there been a discussion of using
blank out signs to stop the rolling right turns?
The following information raises further questions about
the safety effect of Lynwood's cameras.
a. Ticketing has tripled since 2014.
b. Beginning with 2013, California cities having red
light cameras have been
required to file an annual report (see Set # 2, above)
detailing, among other things, the number
of accidents before the program began, compared to the
current year. Lynwood
has been reporting that it has no "before" accident data.
c. Consider the comments
from officials in other LA area cities.
2. The July 5 staff report suggests that the City
may have collected $619,120 from fines in 2016, while the
actual amount was less than $311,000, per the monthly
reports published by the court - see Set # 6, below.
Thus, it is important to watch the finances, including the
monthly rent to be paid to Redflex which, at $3400 per
camera, is too high by double or more. In the last
few years prices have softened, greatly. Del Mar
pays $1578 for each of its three cameras. Elk
Grove's contract provides a rent of $1500 for cameras ten
years old or more. Considering the advanced age of
the red light camera equipment in Lynwood and the City's
willingness to be locked-in to a four-year contract (no
Termination for Convenience), why was Lynwood unable to
obtain any price reduction? If Lynwood agrees to
continue to pay the $3400, it will pay $163,200 extra rent
over the four years (compared to a feasible target rent of
$1700) and will need to issue an extra 2040 tickets in
order to cover that extra rent. (Using staff's
figure of $80 received from each ticket.)
Aug. 2017: Contract Returns for
a Second Vote
The proposed
contract extension was on the agenda for Aug. 15, 2017
and the vote was 3 - 2 to not renew, with Castro
and Santillan-Beas voting for renewal.
Most likely the last day of monitoring will be Aug. 31.
Staff
Report
This list of contracts and amendments was up-to-date as
of Aug. 11, 2017.
Lynwood Docs Set # 5
Ticket Refund?
On June 27, 2017 we wrote to the City:
Due to a statewide rule change, beginning Aug. 1, 2015 the yellow lights at red light camera intersections in California must be set according to the 85th Percentile Speed as determined by an Engineering and Traffic Survey of the street (ETS or, colloquially, a radar speed survey) or, if no ETS is available, according to the posted speed limit plus 7 mph. [See Defect # 2, on the Home page.] On July 18, 2016 we sent the City a public records request for "The current radar speed surveys...," and on Feb. 23, 2017 City staff replied, "The City does not possess any... radar speed surveys." Because there is no current ETS, we used Imperial Highway's posted speed of 40 mph to look up the required yellow in the applicable table in the Caltrans Manual (MUTCD), and it requires a minimum yellow of 4.4 seconds. Per a "current" signal timing chart City staff sent to us on Feb. 23, 2017, the yellow for westbound traffic on Imperial at Atlantic Avenue has been set at 4.0 seconds since 2013, and on Feb. 28, 2017 we personally made a video of that signal in operation and confirmed it was set at 4.0 seconds.
Please refund the red light camera tickets issued after Aug. 1, 2015 by the Imperial/Atlantic camera.
Lynwood Docs Set # 6
The Revenue
The City's monthly ticket revenue from the court is available in the Revenue Spreadsheet on the LA County Docs page.
More Coming
There may be some more information posted in the next few weeks. Mark your calendar to remind you to come back here and look!
RED LIGHT CAMERAS
www.highwayrobbery.net
www.highwayrobbery.net