If
you haven't already done so, please read the Daly
City section on the Camera Towns page
Daly City
Documents
Some of Daly City's tickets can
possibly be ignored. If your "ticket" does not
have the Superior Court's name and address on it, it is
what I call a "Snitch Ticket." For more details,
see the Snitch Ticket section on the Your Ticket page.
In 2014 Sen. Corbett "termed out," and was replaced by this person

Wieckowski, Author of the anti-motorist bills SB 1 and AB 666
who will be running for re-election to the State Senate in 2022 if his current run for Alameda County Supervisor doesn't work out.
In March 2020 please don't vote for
him for Supervisor.
Send him back home to his bankruptcy
law practice.
As of 2019 he still is in the State Legislature in
Sacramento and was the author of SB 246 of 2019 (had
it passed it would have added a 10% tax to each barrel
of oil).
He was co-author of SB 1 which raised gas tax
and car registration fees beginning Nov. 2017 and
which was the subject of an attempted repeal, by
Prop. 6 on the Nov. 2018 ballot.
In 2013 he was the author of AB-666 which - had it
passed - would have increased the number of red
light camera tickets.
Before reaching the Legislature he was a member of
the Fremont City Council, and during his time on the
council he approved two extensions of Fremont's
contract with RedFlex: He was the maker of the
2005 motion to extend the contract to 2010, and in
2010 he made the motion to extend the contract to
June 2017.
Daly
City Docs Set # 1
Ticket
Counts
Total
Violations, Notices Printed [4]
| Cam # |
HIGE-01 |
JDSH-01 |
JSWA-01 |
SPJS-01 |
|
|
|
||||
| DALY CITY |
Hickey & Gellert [6] |
John Daly & Sheffield [6] |
Junipero Serra & Washington [6] |
San Pedro & Junipero Serra [6] |
[3] |
Total Citations Issued as % of Events Re- corded |
Total Violations Recorded/ Notices Printed [1] [4] |
Total Citations Issued/ Rolling Right Citations Per CVC 21455.5(i) Annual Reports All Cameras [12] |
Revenue from Court ($ thou- sands) [11] |
||
| Feb08 |
|||||||||||
| Mar08 |
181 124 |
||||||||||
| Apr08 |
240 175 |
||||||||||
| May08 |
290 136 |
||||||||||
| Jun08 |
257 143 |
||||||||||
| Jul08 |
230 117 |
||||||||||
| Aug08 |
157 67 |
||||||||||
| Sep08 |
253 192 |
||||||||||
| Oct08 |
275 199 |
||||||||||
| Nov08 |
141 92 |
||||||||||
| Dec08 |
171 122 |
||||||||||
| 2008 |
|||||||||||
| Jan09 |
155 105 |
||||||||||
| Feb09 |
131 85 |
||||||||||
| Mar09 |
145 94 |
||||||||||
| Apr09 |
180 101 |
||||||||||
| May09 |
112 76 |
||||||||||
| Jun09 |
52 41 |
123 68 |
175 109 |
||||||||
| Jul09 |
124 104 |
298 232 |
80 51 |
87 57 |
589 444 |
||||||
| Aug09 |
214 155 |
340 244 |
167 129 |
86 55 |
807 583 |
||||||
| Sep09 |
168 137 |
245 187 |
258 181 |
100 77 |
771 582 |
||||||
| Oct09 |
157 120 |
157 111 |
304 252 |
136 105 |
754 588 |
||||||
| Nov09 |
147 100 |
23 12 |
304 229 |
138 105 |
612 446 |
||||||
| Dec09 |
155 120 |
200 152 |
252 196 |
148 93 |
755 561 |
||||||
| 2009 |
|||||||||||
| Jan10 |
88 67 |
203 143 |
226 179 |
120 68 |
637 457 |
||||||
| Feb10 |
80 61 |
188 159 |
204 161 |
105 84 |
577 465 |
||||||
| Mar10 |
110 82 |
212 160 |
240 183 |
136 93 |
698 518 |
||||||
| Apr10 |
113 65 |
193 130 |
238 151 |
99 61 |
643 407 |
||||||
| May10 |
127 81 |
232 187 |
250 171 |
37 20 |
646 459 |
||||||
| Jun10 |
137 83 |
237 174 |
196 138 |
7 3 |
577 398 |
||||||
| Jul10 |
112 74 |
225 163 |
199 130 |
0 0 |
536 367 |
||||||
| Aug10 |
99 62 |
240 194 |
186 131 |
62 39 |
587 426 |
||||||
| Sep10 |
117 83 |
277 211 |
201 135 |
171 122 |
766 551 |
||||||
| Oct10 |
129 70 |
245 200 |
222 159 |
167 111 |
763 540 |
||||||
| Nov10 |
122 95 |
210 162 |
204 146 |
166 107 |
702 510 |
||||||
| Dec10 |
153 76 |
200 151 |
235 157 |
161 107 |
749 491 |
||||||
| 2010 [2] |
1387 899 |
2662 2034 |
2601 1841 |
1231 815 |
71% |
7881 5589 |
|||||
| Jan11 |
618 442 |
||||||||||
| Feb11 |
512 364 |
||||||||||
| Mar11 |
564 322 |
||||||||||
| Apr11 |
541 325 |
||||||||||
| May11 |
169 49 |
105 77 |
121 75 |
136 84 |
531 285 |
||||||
| Jun11 |
566 307 |
||||||||||
| Jul11 |
551 379 |
||||||||||
| Aug11 |
633 435 |
||||||||||
| Sep11 |
121 93 |
117 83 |
174 66 |
96 19 |
508 261 |
||||||
| Oct11 |
443 313 |
||||||||||
| Nov11 |
429 321 |
||||||||||
| Dec11 |
496 359 |
||||||||||
| 2011 [2] |
64% |
6392 4113 |
|||||||||
| Jan12 |
468 252 |
||||||||||
| Feb12 |
440 270 |
||||||||||
| Mar12 |
529 304 |
||||||||||
| Apr12 |
534 341 |
||||||||||
| May12 |
120 89 |
108 69 |
181 116 |
155 84 |
564 358 |
||||||
| Jun12 |
531 296 |
||||||||||
| Jul12 |
494 262 |
||||||||||
| Aug12 |
535 245 |
||||||||||
| Sep12 |
131 59 |
131 70 |
185 112 |
129 56 |
576 297 |
||||||
| Oct12 |
576 281 |
||||||||||
| Nov12 |
549 278 |
||||||||||
| Dec12 |
507 253 |
||||||||||
| 2012 [2] |
55% |
6303 3437 |
|||||||||
| Jan13 |
445 219 |
||||||||||
| Feb13 |
462 256 |
||||||||||
| Mar13 |
546 241 |
||||||||||
| Apr13 |
513 270 |
||||||||||
| May13 |
115 46 |
145 79 |
201 130 |
135 61 |
596 316 |
||||||
| Jun13 |
552 251 |
||||||||||
| Jul13 |
549 303 |
||||||||||
| Aug13 |
536 302 |
||||||||||
| Sep13 |
146 81 |
154 108 |
150 108 |
114 50 |
564 347 |
||||||
| Oct13 |
594 343 |
||||||||||
| Nov13 |
509 290 |
||||||||||
| Dec13 |
589 324 |
||||||||||
| 2013 [2] |
54% |
6455 3462 |
1953 410 |
||||||||
| Jan14 |
535 277 |
||||||||||
| Feb14 |
427 229 |
||||||||||
| Mar14 |
537 270 |
||||||||||
| Apr14 |
569 288 |
||||||||||
| May14 |
82 30 |
134 83 |
158 94 |
180 89 |
554 296 |
||||||
| Jun14 |
387 178 |
||||||||||
| Jul14 |
[9] |
418 222 |
|||||||||
| Aug14 |
503 265 |
||||||||||
| Sep14 |
134 65 |
139 92 |
150 93 |
147 79 |
570 329 |
||||||
| Oct14 |
553 343 |
||||||||||
| Nov14 |
456 296 |
||||||||||
| Dec14 |
583 395 |
||||||||||
| 2014 [1] |
1293 610 |
1261 816 |
1723 1068 |
1818 902 |
56% |
6095 3396 |
2009 413 |
||||
| Jan15 |
109 72 |
181 120 |
106 72 |
171 101 |
567 365 |
||||||
| Feb15 |
101 76 |
149 123 |
157 93 |
141 85 |
548 377 |
||||||
| Mar15 |
120 93 |
174 127 |
173 111 |
177 108 |
644 439 |
||||||
| Apr15 |
131 96 |
119 84 |
193 126 |
156 91 |
599 397 |
||||||
| May15 |
116 69 |
129 89 |
165 88 |
196 117 |
606 363 |
||||||
| Jun15 |
121 75 |
133 67 |
193 120 |
211 113 |
658 375 |
||||||
| Jul15 |
152 66 |
148 94 |
214 88 |
204 116 |
718 364 |
34 |
|||||
| Aug15 [10] |
177 79 |
192 127 |
165 101 |
217 115 |
751 422 |
29 |
|||||
| Sep15 [10] |
145 74 |
199 135 |
152 102 |
181 107 |
677 418 |
33 |
|||||
| Oct15 [10] |
173 112 |
179 137 |
151 79 |
229 145 |
732 473 |
32 |
|||||
| Nov15 [10] |
145 105 |
104 58 |
136 72 |
143 87 |
528 322 |
34 |
|||||
| Dec15 |
132 90 |
71 38 |
153 97 |
184 116 |
540 341 |
12 |
|||||
| 2015 [2] |
1622 1007 |
1778 1199 |
1958 1149 |
2210 1301 |
62% |
7568 4656 |
2841 446 |
||||
| Jan16 |
122 67 |
86 56 |
134 89 |
178 109 |
520 321 |
26 |
|||||
| Feb16 |
158 105 |
96 57 |
193 129 |
193 139 |
640 430 |
26 |
|||||
| Mar16 |
114 78 |
68 46 |
185 120 |
241 175 |
608 419 |
32 |
|||||
| Apr16 |
146 100 |
84 56 |
200 133 |
248 168 |
678 457 |
30 |
|||||
| May16 |
132 69 |
86 46 |
212 136 |
251 147 |
681 398 |
37 |
|||||
| Jun16 |
170 94 |
100 73 |
125 78 |
254 153 |
649 398 |
23 |
|||||
| Jul16 |
196 76 |
86 57 |
247 158 |
180 115 |
709 406 |
26 |
|||||
| Aug16 |
168 57 |
110 52 |
210 95 |
208 96 |
696 300 |
38 |
|||||
| Sep16 |
183 85 |
103 52 |
243 118 |
195 88 |
724 343 |
31 |
|||||
| Oct16 |
167 89 |
119 61 |
273 145 |
174 75 |
733 370 |
24 |
|||||
| Nov16 |
185 94 |
106 49 |
242 113 |
219 80 |
752 336 |
24 |
|||||
| Dec16 |
141 71 |
104 50 |
307 142 |
203 91 |
755 354 |
24 |
|||||
| 2016 [2] |
1882 985 |
1148 655 |
2571 1456 |
2544 1436 |
56% |
8145 4532 |
2777 459 |
341 |
|||
| Jan17 |
130 67 |
94 49 |
264 154 |
180 93 |
668 363 |
36 |
|||||
| Feb17 |
97 68 |
92 66 |
221 143 |
204 122 |
614 399 |
26 |
|||||
| Mar17 |
146 81 |
106 52 |
277 138 |
218 103 |
747 374 |
31 |
|||||
| Apr17 |
154 93 |
113 74 |
249 146 |
211 114 |
727 427 |
31 |
|||||
| May17 |
178 69 |
140 62 |
288 145 |
266 108 |
872 384 |
31 |
|||||
| Jun17 |
160 50 |
98 39 |
267 107 |
286 125 |
811 321 |
29 |
|||||
| Jul17 |
181 54 |
107 33 |
282 121 |
218 74 |
788 282 |
27 |
|||||
| Aug17 |
225 52 |
121 52 |
266 111 |
176 67 |
788 282 |
29 |
|||||
| Sep17 |
204 76 |
105 56 |
312 144 |
183 77 |
804 353 |
26 |
|||||
| Oct17 |
221 99 |
115 51 |
351 141 |
222 93 |
909 384 |
24 |
|||||
| Nov17 |
213 58 |
122 45 |
337 123 |
210 73 |
882 299 |
21 |
|||||
| Dec17 |
222 46 |
117 28 |
282 59 |
209 48 |
830 181 |
21 |
|||||
| 2017 [1] |
2131 813 |
1330 607 |
3396 1532 |
2583 1097 |
43% |
9440 4049 |
2569 351 |
332 |
|||
| Jan18 |
166 63 |
99 49 |
263 128 |
183 77 |
711 317 |
21 |
|||||
| Feb18 |
208 81 |
114 37 |
234 80 |
176 59 |
732 257 |
19 |
|||||
| Mar18 |
206 46 |
132 35 |
273 60 |
240 65 |
851 206 |
23 |
|||||
| Apr18 |
194 35 |
115 25 |
318 73 |
261 54 |
888 187 |
20 |
|||||
| May18 |
225 23 |
140 21 |
271 55 |
287 35 |
923 134 |
21 |
|||||
| Jun18 |
254 35 |
130 23 |
293 57 |
280 58 |
957 173 |
15 |
|||||
| Jul18 |
244 5 |
163 19 |
344 39 |
260 25 |
1011 88 |
15 |
|||||
| Aug18 |
210 18 |
172 29 |
306 53 |
283 46 |
971 146 |
11 |
|||||
| Sep18 |
219 31 |
168 38 |
248 44 |
284 52 |
919 165 |
10 |
|||||
| Oct18 |
278 33 |
190 22 |
285 19 |
30 54 |
1059 128 |
11 |
|||||
| Nov18 |
216 53 |
153 42 |
329 87 |
274 63 |
972 245 |
13 |
|||||
| Dec18 |
261 47 |
166 26 |
406 76 |
279 45 |
1112 194 |
10 |
|||||
| 2018 [1] |
2681 470 |
1742 366 |
3570 771 |
3113 633 |
20% |
11106 2240 |
1459 189 |
189 |
|||
| Jan19 |
185 66 |
148 51 |
300 108 |
237 84 |
36% |
870 309 |
14 |
||||
| Feb19 |
166 53 |
136 64 |
325 135 |
205 89 |
40% |
832 341 |
16 |
||||
| Mar19 [5] |
946 396 |
24 |
|||||||||
| Apr19 [5] |
1071 690 |
25 |
|||||||||
| May19 [5] |
1419 924 |
34 |
|||||||||
| Jun19 [5] |
1291 794 |
45 |
|||||||||
| Jul19 [5] |
1379 741 |
62 |
|||||||||
| Aug19 [5] |
410 316 |
176 111 |
395 242 |
353 258 |
1334 927 |
57 |
|||||
| Sep19 [5] |
355 282 |
164 111 |
411 252 |
356 248 |
1286 903 |
||||||
| Oct19 |
1194 733 |
||||||||||
| Nov19 |
1126 627 |
||||||||||
| Dec19 |
1094 686 |
||||||||||
| 2019 [1] |
3671 2352 |
1877 1069 |
4383 2339 |
3911 2211 |
58% |
13842 7971 |
|||||
| Cam # |
HIGE-01 |
JDSH-01 |
JSWA-01 |
SPJS-01 |
|
|
|
||||
| [8] |
Hickey & Gellert [6] |
John Daly & Sheffield [6] |
Junipero Serra & Washington [6] |
San Pedro & Junipero Serra [6] |
[3] |
Total Citations Issued as % of Events Re- corded |
Total Violations Recorded/ Notices Printed [1] [4] |
Total Citations Issued/ Rolling Right Citations Per CVC 21455.5(i) Annual Reports All Cameras [12] |
Revenue from Court ($ thou- sands) [11] |
This table made by highwayrobbery.net, using official reports provided by the City under the California Public Records Act.
Official report, Mar. 2008
Official report, Apr. 2008
Official reports, 2008 - 2010
Official reports, 2011 - 2012
Official reports, 2012 - 2013
Official reports, 2013 - 2014
Official reports, 2011 - 2015
Official reports, mid 2015
Official reports, late 2015
Official reports, early 2016
Official reports, 2010 - mid 2016
Official reports, Fall 2016
Official reports, 2015 - mid 2017 [10]
Official reports, 2017 - 2018
Official reports, May 2018 - Sept. 2018
Official reports, 2018 - 2019
Official reports, to Oct. 2019
Official reports, to Dec. 2019
[ ] indicates a footnote.
[1] Totals are as provided by the City.
[2] Annual total, or projection, by highwayrobbery.net.
[3] Un-used columns are to allow for later expansion of City's system.
[4] Any figures in red type (or, if you are looking at this table in black and white, the upper figure when there are two or more figures in a cell) are what RedFlex calls Total Violations, or all incidents recorded by the cameras, and due to time limitations may have been posted here only for selected months or locations. If there is sufficient public interest, the remaining months will be posted. The figures in black type are what RedFlex calls Notices Printed, and represent the sum of genuine citations issued (those filed with the court) plus any Nominations mailed (not filed with the court, a.k.a. Snitch Tickets).
[5] The official monthly reports for mid-2019 were requested on 10-11-19 and received on 11-22-19.
[6] The camera enforcement is believed to be on traffic on the first-named street, but the direction of enforcement (north, south, east, west, thru, left, right) is not yet available.
[7] Includes enforcement of posted "no turn on red" signs.
[8] The title bar has been repeated solely for the convenience of the reader - there is no difference between it and the one at the top of the table.
[9] The official report for this month was prepared close to the end of the month, so may not be complete.
[10] Over 300 of the tickets from these months were dismissed. When we re-requested the reports in 2017, the official numbers had not been adjusted. See Set # 9, below.
[11] To see the latest editions of the Court's official tables of how much fine money the Court has
sent to the City, go to Docs Set # 5 on the San Mateo Docs page.
[12] From the annual reports required, beginning with 2013, by CVC 21455.5(i). They become available by the Fall of the following year.
Ticketing Highlights
The 2019 jump in the amount of fine money flowing from the court to Daly City (the figures in the rightmost column in the table above) was the first hint that in early 2019 the city doubled, or more, the number of red light cam tickets issued each month.
(We requested the official month-by-month ticketing reports on 10-11-19 but did not receive them until 11-22-19.)
Daly City Docs Set # 2
"Late Time" Graphs
The City provided bar graphs of Late Times, etcetera, at four intersections.
These graphs track violations recorded, not tickets issued.
Where there is a large number of long Late Time violations in a curb lane, it is believed to indicate heavy ticketing on right turns.
(The curb lane will be the lane with the highest lane number.)
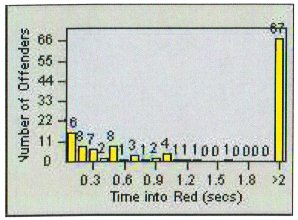
The picture above is an example from another city.
17 months up to July 2009
Jan 2009
July 2009
HIGE July 2010
JDSH July 2010
JSWA July 2010
SPJS July 2010
July 2012
July 2014
2014 Twelve Months
Aug. 2015 (tabular version)
2015 Twelve Months
July 2016
April 2019
Bar graphs are available for more than fifty other cities - see the list in the expanded version of Defect # 9.
Daly City Docs Set # 3
2009 & 2011: Successful Appeals
In Dec. 2009 and Jun. 2011 defendants won appeals on the
cost neutrality issue. P.
v. Lopez, P. v. Chew.
In response, the City revised its contract, as did San
Mateo after its loss in P. v. Bullock.
But then in late 2019 the City approved a new contract
which appears to re-instate cost neutrality.
Daly City Docs Set # 4
The Contract -
Paying Way Too Much, with No Escape
2007
Contract
In Mar. 2007 the city council approved a contract, in which they agreed to pay RedFlex $6000 per month, per camera, for five years.
The contract included an illegal "cost
neutrality" clause, whereby the City did not have to pay
RedFlex the full rent if there weren't enough fines to
cover the cost. See Subsection B. of Defect # 10.
The contract also said: Definitions.
"Warning Period" means the period of thirty (30)
days after the Installation Date of the first
intersection approach. (Emphasis added.) See
Defect # 6.
A 2011
amendment removed cost neutrality.
The contract was due to expire in a few
months, so on Dec. 10, 2012 we wrote to the City
Council, suggesting that if they decided to renew the
contract, they should not agree to pay more than $3000
per camera, per month.
(To see a list of cities that pay less than $3000, go to
FAQ # 17.)
On Jan. 14, 2013 the City Council approved, without
discussion, a contract
amendment in which they agreed to pay $5520 rent
for each camera each month, which when compared to a
$3000 target price means the City overpaid by $604,800
over the five-year term, enough money to purchase and
equip a dozen new patrol cars.
Or, looking at it as the motoring public would:
To cover that extra rent, the City needed to issue an
extra 6048 tickets (assuming that the City received
$100 of revenue from each ticket issued).
The amendment also provided
for automatic renewal of the contract!
(Renewal should never be automatic - this is not a
contract for cable TV! Renewals should occur only
after a public review by the City Council.)
The amended contract did not include an escape clause (Termination at the Convenience of the City), so the City was stuck paying the too-high rent for five years, until Jan. 2018.
In 2014 we noticed that Elk Grove, a
RedFlex customer having five cameras, had negotiated
camera rents much lower than those in Daly City.
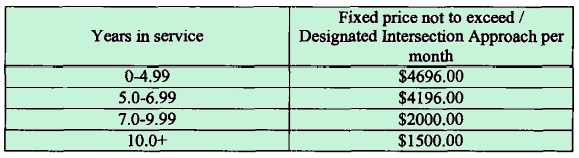
Table from
March 2014 contract between the City of Elk Grove,
California and RedFlex, for the City's system of five
cameras.
Daly City's first
automatic renewal was due to occur in Jan. 2018,
so in Nov. 2017 we sent them a copy of the Elk Grove
pricing table and suggested that they bargain to get the
rent down to $2000.
Daly City took no action, eventually allowing a second
one-year automatic renewal to occur. They continued
to pay $5520 per camera, so they overpaid by $337,920
during the extra two years.
The total overpayment during the 5 + 2 years?
$942,720.
Late 2019: Contract Extended 5
Years
There were no more automatic renewals,
so the city's contract with Redflex was to expire in
January 2020. The city council voted, at the
council meeting of Nov. 25, to extend the
program for another five years (plus two one-year
automatic renewals) and with a rent of $5000 per camera.
Over the five years the City will pay $720,000 extra
when compared to Elk Grove prices, and to cover that
extra rent they will need to issue an extra 7200
tickets.
The new contract appears to re-instate
cost neutrality, which was removed by a 2011 amendment.
Here
are some reasons they should have let the program end.
Staff
Report
Proposed
Contract
Signed
Contract
This list of contracts and amendments was up-to-date as
of Jan. 21, 2020.
Daly City Docs Set # 5
How Much They
Get
Daly City Docs Set # 6
Prevailing
Wage Action
RedFlex' construction work in Daly City was the subject
of a Prevailing
Wage action by the California Department of
Industrial Relations.
Daly City Docs Set # 7
The Business Rules
Business
Rules, as of Sept. 2014
An official report showed that in 2017, 58% of the City's tickets were for turns, mostly left turns.
Daly City Docs Set # 9
Signal Timing & Big Refund/Dismissal
in 2015
The City failed to lengthen its
straight-thru yellows prior to the Aug. 1, 2015 deadline
(see Defect # 2 for more info about the deadline), and
in Dec. 2015 asked the court to cancel (or refund)
300+ tickets issued Aug. 1 or later.
City's
Correspondence about the Refund
List
of Tickets to be Refunded (78% went to
visitors to Daly City)
Signal
Timing Charts, Surveys, Etc. Rec'd in 2016
Signal
Timing Charts Rec'd in 2019
Daly City Docs Set # 10
Countywide
Info
Including a Grand Jury Report
about the Cameras
Look in Countywide Info on the San
Mateo Docs page for info about the judges, the court,
and the Grand Jury report.
Daly City Docs Set # 11
More Coming
There may be some more Daly City information posted in the next few weeks. Mark your calendar to remind you to come back here and look!
---------------------------------
RED LIGHT
CAMERAS
www.highwayrobbery.net
www.highwayrobbery.net